It’s nature’s energy

In science class lately we have been working on our sustainable/nature electricity projects. My group (Maggie, Lucas and me) decided to take a different route. We decided to create a pulley to generate our electricity. We had learned a whole bunch about sustainable energy and where we can source it from and how we can source it, so our idea didn’t take to much time to produce! We decided that we would capture the mechanic energy that is produced when rain falls. We thought to harness the gravity pull from the water to turn our pulley and power our lights. Though in the end using a pulley system didn’t really pay off for my group and I. We realized that the effort the person would have to put in to generate electricity is far to much, and that the machine does not run consistently. Our machine does work, but in the future we can think about how the energy sourced will have an impact on the people who buy it.

Here is the video we made to sell our machine. In the video you will see the the comparison between the machine and solar panels. Our machine actually makes more energy then solar panels at this time of the year because the sun is only out for 1/3 of the day, instead of all day. Whereas with our machine we are capable of catching energy all day if there is rain all day! 

Throughout this project we learned a lot of core competencies. I thought it would be a good idea to talk about the 3 core competencies that I think I saw the most of during this project.

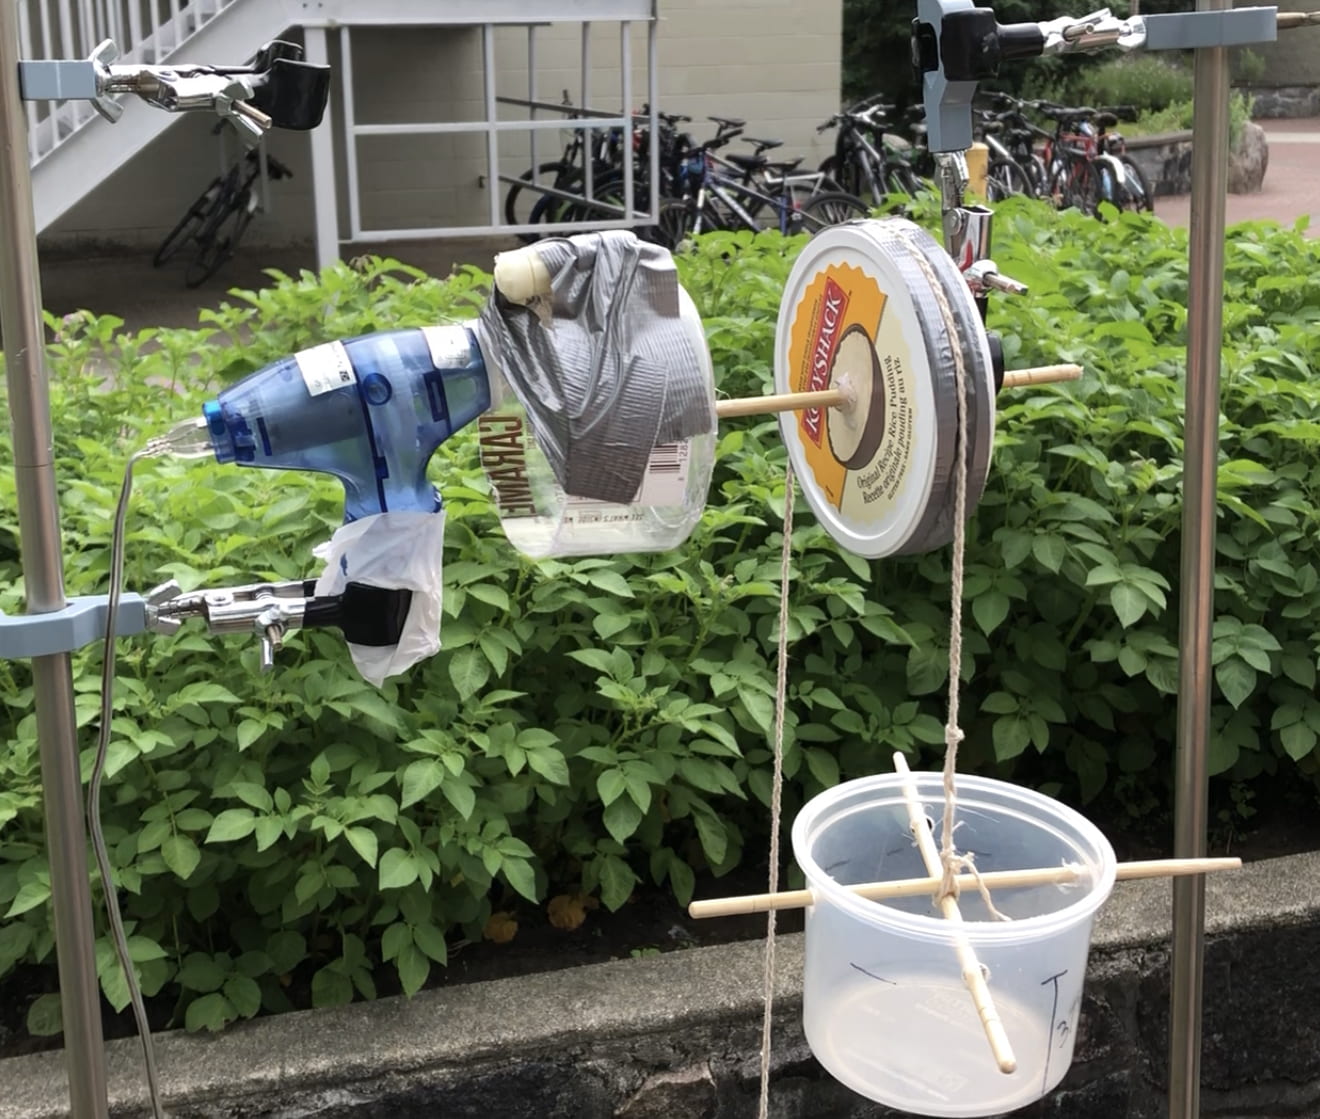
The first core competency I used was collaboratively and individually plan, select, and use appropriate investigation methods, including field work and lab experiments, to collect reliable data. I used this core competency because to conduct our research we had to figure out the wats and joules our machine produced before we could tell how long it would take to power a iPhone. We used our field research to figure out the first draft of our product, which we tested and realized what worked and what didn’t work. 

The second core competency that I used was construct analyze and interpret graphs interpret graphs (including interpolation and extrapolation), models and or diagrams. I used this core competency because throughout the project my group and I used graphs to demonstrate our learning. We used graphs to show the contrast between our product and solar panels when comes to generating energy. We also used graphs to show our cost savings over time. 

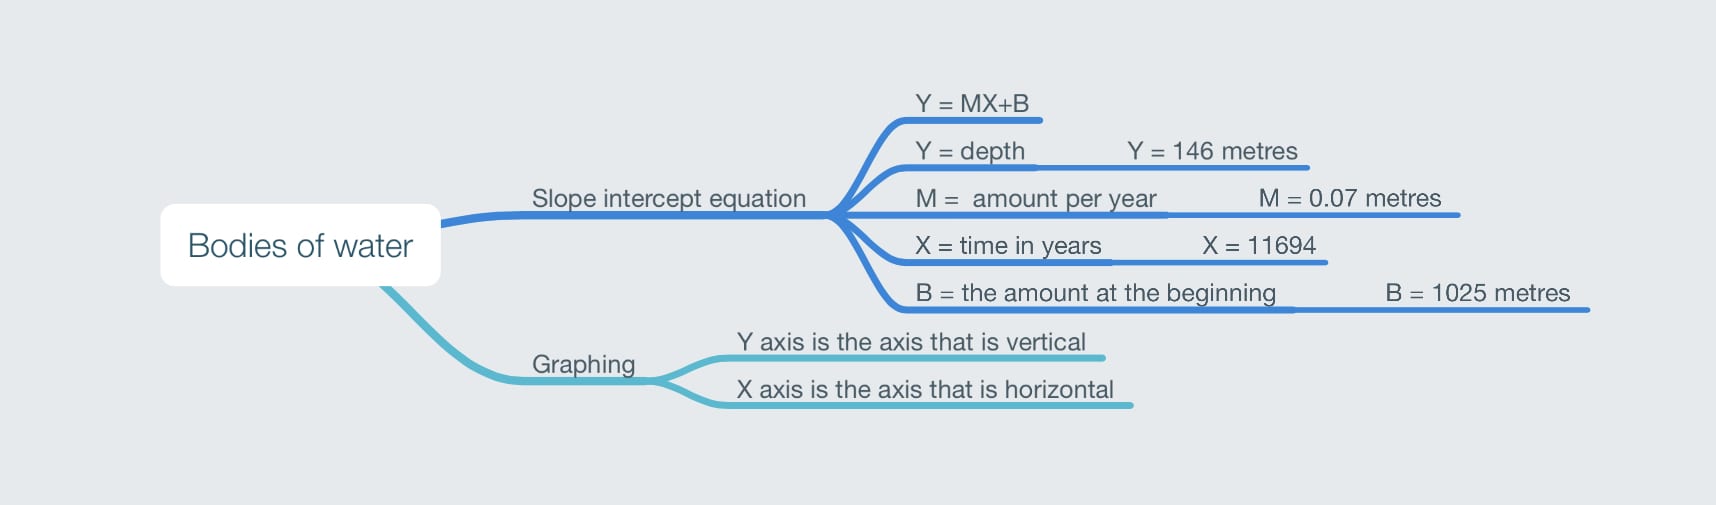
The third core competency I used was formulate physical or mental theoretical models to describe a phenomenon. I used this core competency when my group and I created our diagram showing how our energy gets generated and where it comes from!

Cell phone slope!

Recently in scimatics we have been exploring the costs for phone plans with when you need to roam for calls outside of canada. To start our work off we decided to pick the companies that we would be researching during the project. We chose to research Rogers, Bell and Telus. 


The plans we found for each are as follows:

Rogers = $2.00 per minute roaming, and a starting cost of $165

Telus = $1.50 per minute roaming, and a starting cost of $180

Bell = $1.45 per minute roaming, and a starting cost of $195

The next step was to turn this information into a slope intercept equation. The slope intercept equation makes it so that you can graph the equation. In the slope intercept equation  each letter has a meaning they are : Y=MX+B.

Y = the grand total, what you want to find out.

M = the slope intercept.

X = the first variable, the amount you have per will have.

B = the Y intercept

Here are the equations for the cell phone companies.

Rogers: y = 2.00x + 165

Telus: y = 1.50x + 180

Bell: y = 1.45x + 195

We then graphed these equations to see the slope of them. These are the graphs that we made. 

Rogers is purple, Telus is red, and bell is green. The best cell company, most affordable, would be Bell after 300 minutes roaming!

The final step of the project was to make a keynote to show our leaning to the class. Our keynote was a simple step by step version of this blog post. To make our project unique, Morgan and I decided to create a rap to help other people understand our project and alos to create a more unique lens on this project. 

Here is our keynote


Throughout this project I used a few curricular competencies. I would like to mention what they are and how I used them below!

The first competency I used was explore, analyze and apply mathematical ideas using reason, technology and other tools. I used this competency because throughout the project I was constantly learning about analyzing new mathematical ideas such as the slope equation, and then applying it to our project, and finding where our facts and ideas would fit into the equation.

The second competency I used was represent mathematical ideas in concrete, pictorial and symbolic forms. I used this competency because for my end project I was able to show my learning in many different forms. We had concrete forms of our math in the form of graphs and equations and to spice it up a bit, we decided to do a rap, and rap the math to have a more creative form of our project!

The final curricular competency that I used was using mistakes as opportunities to advance learning. Throughout the project we made a few mistakes with our math, but instead of getting down, or continuing to present math that was incorrect, we decided to ask around and figure out how to properly present the math in graph form!

Thank you for reading!

adlih

How long do we have?

For grade 10 PLP students we got the lucky chance to explore linear equations in our everyday life. Mr. Gross asked us to think about the rising and falling water levels across the globe, and see what the water levels are like in seas and lakes across the world.

To do this we needed to learn about the linear slope equation y=mx+b. Each letter in this equation signifies something. Y is used to produce the depth of our equation. So how deep our final product will be. M is the amount of water that is leaving the body of water per year. X is the amount of time that this would take, and B is the amount of water that you start with. Now since we had all the background knowledge, it was time to figure out what body of water we wanted to choose. I was in a group with Luca Jacoe, and we decided to pick the Caspian Sea. (Really just a big lake). We did our research on the Sea and found all the numbers that we needed to, so we created our first equation.

Here is our equation. 

Since we don’t know Y and we don’t know X we have to solve for both of them. So the equation below signifies that. 

We then took our equation to Desmos to produce a graph with all the information we had. 

Here is our graph.

After creating the graph we also finished our equation by finding the values for X and Y. X which was time was equal to 11694 years (until the whole of the Caspian Sea disappears), And Y, which was depth, was 146 metres. 

We then presented our findings to the class in a keynote where we were able to share the knowledge we had built through our project.

Our keynote described the steps we took to come to our final product but it didn’t share the Curricular Competencies…

In this project I think that I improved upon the Curricular Competency “estimate reasonably and demonstrate fluent, flexible, and strategic thinking about number.” I think that I increased my knowledge in this competency because throughout the project I would be thinking about the slope intercept equation and using my predictive skills to determine what the correct answers were. 

I also used the competency “solve problems with persistence and a positive disposition.” I chose this competency because I was able to keep pushing myself to find the proper information for our equation, and trying to solve for 2 variables. I didn’t get turned away when I got it wrong, but instead tried it again.

Another competency I used was “take risks when offering ideas in classroom discourse.” I choose this competency because I felt that I definitely took risks when I was presenting ideas to my group, and when we were planning it out through sharing my concerns and ideas. 

My final competency that I used was “reflect on mathematical thinking.” Through this blog post I am reflecting on the learning that I presented and learned throughout the project period. I get to talk about what math I learned and what I got to explore through out these past few weeks. 

So thank you very much for reading, and I hope you have a good day!

Alge-go!


Recently in scimatics we have been working on a math game that can fully achieve the concept of algebra, as well as being fun for all ages, and easy to play. Luca and I decided that we would make a game the brings out competition as the drive. That harnesses the need to better the other player, what I’m talking about is Alge-go.

Alge-go is a game that takes an interesting stand point on the competition aspect of games. It derives from the betting but with out anything to lose when playing the game, it does not bring with it all the negative aspects of betting. The game is simple to play. It starts with both of the players figuring out which one is the youngest. Once they’ve figured out which person is the youngest, that person gets to go first. The first step is telling their opponent how many algebra cards they can answer in one minute. After the youngest person has told the competitor how many cards they can answer the competitor gets a shot to say more cards then what the younger person said. If they dont think they can answer as many cards as the first person said, then they can back off, but if they think they can say a higher number.


It can go back and forth like this till someone has said the highest number. Once somebody has said the highest number, and the other player has backed down, it is up to the player with the said highest number to fulfil the number of algebra equations that they said. If they fail the point goes to the opponent, if they succeed they receive the point. And then the turn starts all over agin, and the first player to zero wins. (You start with -5 points!)

The Curricular competencies I worked on for this project are thinking creativity about the solutions to problems and how to create a game that shows all we’ve learned in a fun way, and as well as thinking creativity I also had to developers new thinking strategies, to help myself and others understand the concepts!

Thanks for reading

Adlih

Could your cousin be your twin??

Scimatics has puzzeled us with the challenge of answering the question, that remains quite confusing. The question is: Could cousins be twins? Now thats a pretty weird question, because you’d think that it is a definite no, but there is actually a minuscule chance of it happening in real life! Luca O, and I created a video made from the perspective of the girl who thinks her cousin could be her twin. Give it a watch and maybe that will help you understand the question and situation a bit more. 

Now that you’ve seen the video and you understand the question a bit more, I explain the parts that make a little bit less sense. The first point that is really important to the question is: the parents of both of the cousins are twins. By this I mean that the uncle and the dad are identical twins and the aunt and the mom are twins. This means that 2 children born at the same time could have the possibility of being identical. The next point that is important is the steps to figuring out if they are or are not twins. The first step is the phenotype of the child. To figure out certain phenotypes of the children you would have to use a punnet square.

A punnet square is a way of showing the percentage of attaining a certain phenotype. We also used a punnet square to figure out the genotypes. Genotypes are the characteristics of a person on the inside! We also used Meiosis. Meiosis is a type of cell division that splits 2 chromosomes into 4 daughter cells. Once we were finished with the science we filmed and edited and in the end we figured out that there is a very small chance of this ever happening in real life, but it might just happen one day!…

Solar panels and ethical housing

Recently in scimatics 9 we have been working on creating a solar powered structure, these solar powered structures need to be equipped with a purpose and a lot of mathematics. We started with a destination which we chose Kharga Egypt,

and we then had to figure out the angle of the sun, and the different angles of the solar panel.

We used our knowledge in SOH CAH TOA to complete the math and then we put the angles on to our structure, which was a shipping container turned ethical housing development!

In the end we learned a lot about different angles in a real world way! This is the video we created to explain some of the steps we want through while creating this idea! Hope you enjoy!

Correlation and causation

Math blog post

In math 9 we have been working on a project on causation and correlation, and how we can relate this to our society today and to people around us.
Before I start this post I would like to explain what correlations, and causations are.
A correlation is when two sets of data increase or decrease at the same time, but have no other relation.
A causation is where the data in question is related and if one set goes up, then it makes the other set go up as well.

For our project Isabelle, Luca, and I created a keynote to show our learning, and studies into these topics. For our correlation project we compared gas price, to college tuition over the years.


In this chart we show how the increase of both are not related in anyway, proving that it is in fact a correlation.

For the causation part of the project, I had to ask around the class to see who had a keyboard on their iPad, and how long it takes to write a blog post.

The information in the chart above is the information that I collected when I went around asking people in the class. We put the information into a graph and I averaged it out, and it showed that people with keyboards usually take an hour less time writing a blog post!

That is my math project, and hope you liked the post

We made a research proposal video

Recently in science 9 we have been working to complete our research proposal videos. You may be wondering what a research proposal video is, and I can answer that for you. A research proposal video is a video based around the research that you have done on a certain topic, or field of research. In this video you are explaining your procedure and what the main goal is of your experiment. The main part of the research proposal video is asking for money. You need money to complete your experiment, so that is exactly what we did.


We started our project with Mr. Gross teaching us about the different ways to clone a plant, like sexual and asexual.
You might be wondering what the differences are between the two, and I can help with that.


Asexual reproduction is when the adult cell is cloned to make the new cell an exact copy of the parent cell.

Sexual reproduction is when you have 2 parent cells and they come together and give the child cell each half. This is the way that children are born. The benefits of sexual reproduction is that every cell will be different so it is very hard for a disease to come and kill everyone off, also the species can adapt over time.

We then learned about the different ways to clone plants, like grafting, cutting, air layering, and layering. Hypothetically, after we sexually reproduce a tone of dandelions, we would like to clone the ones that have a advantage over the rest, such as thicker leaves and bigger flowers. (For our final project) And since I’m on the topic of final projects, I would like to talk to you about our final project and how ours went.

I got put into a group with Maggie and Daniel. Maggie Daniel and I worked really hard on a script and came up with some really good information. We realized that dandelions leaves hold a whole bunch of secrets, one of them being that they are packed with fibre.

Now fibre is good for you, but it is a jem for people who are constipated, so our idea was formed. We then needed to create a whole script explaining the reasoning behind all of this and why people should want to give us money. That was my part, an I really enjoyed planning a research experiment, and finding all of the tools!
In the end I think I learned a ton and had a bunch of fun planning this hypothetical research proposal video, and cant wait to share it with you!

Thanks for taking the time to read this, and I hope your next hour is a sweet one.

Adlih