 The beginning of the second quarter in the school year marked the start of this new project called “Fractions of Your Time!” For this project, our driving question was “What fraction of my week is spent on screen time?” At first, I wasn’t sure what to expect when we started tracking our screen time. However, as the days went on, and our spread sheets got more detailed, it also became more predictable as to what our answers to the driving question will be.
MILESTONE 1: Whiteboard Fractions
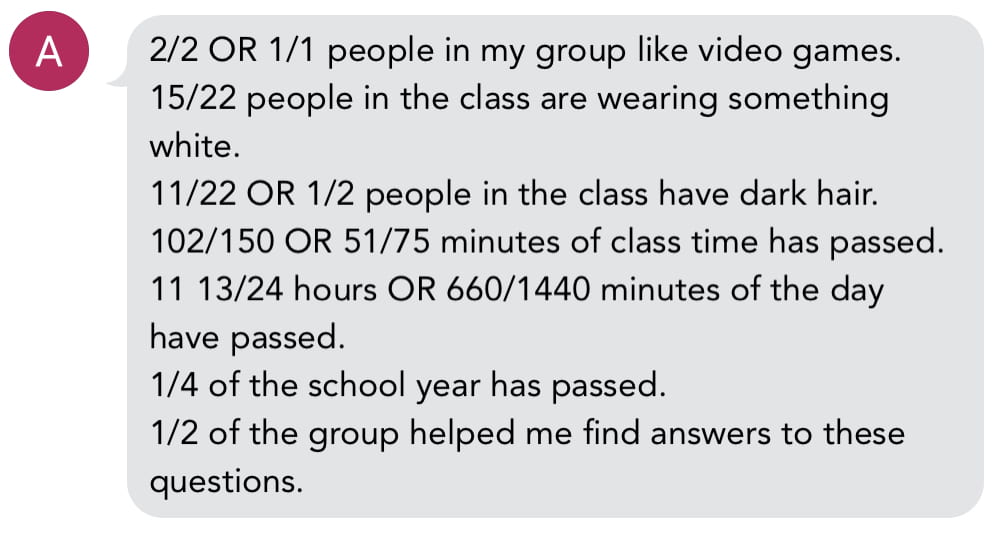
Here are my answers for this Milestone.
We worked with the person sitting beside us for this activity. We had to write the following as a fraction:
– The number of people in the class wearing something white
– The number of people in the class with dark hair
– The amount of class time that passed
– The amount of the day that has passed
– The amount of the school year that has passed
– The amount of people in your group who helped find the answers to these questions
After yet another day spent working on math homework, we were given a quiz on both adding and subtracting fractions. This quiz was a review of math homework we were assigned prior to the test.
MILESTONE 4: Spreadsheet For Time Tracking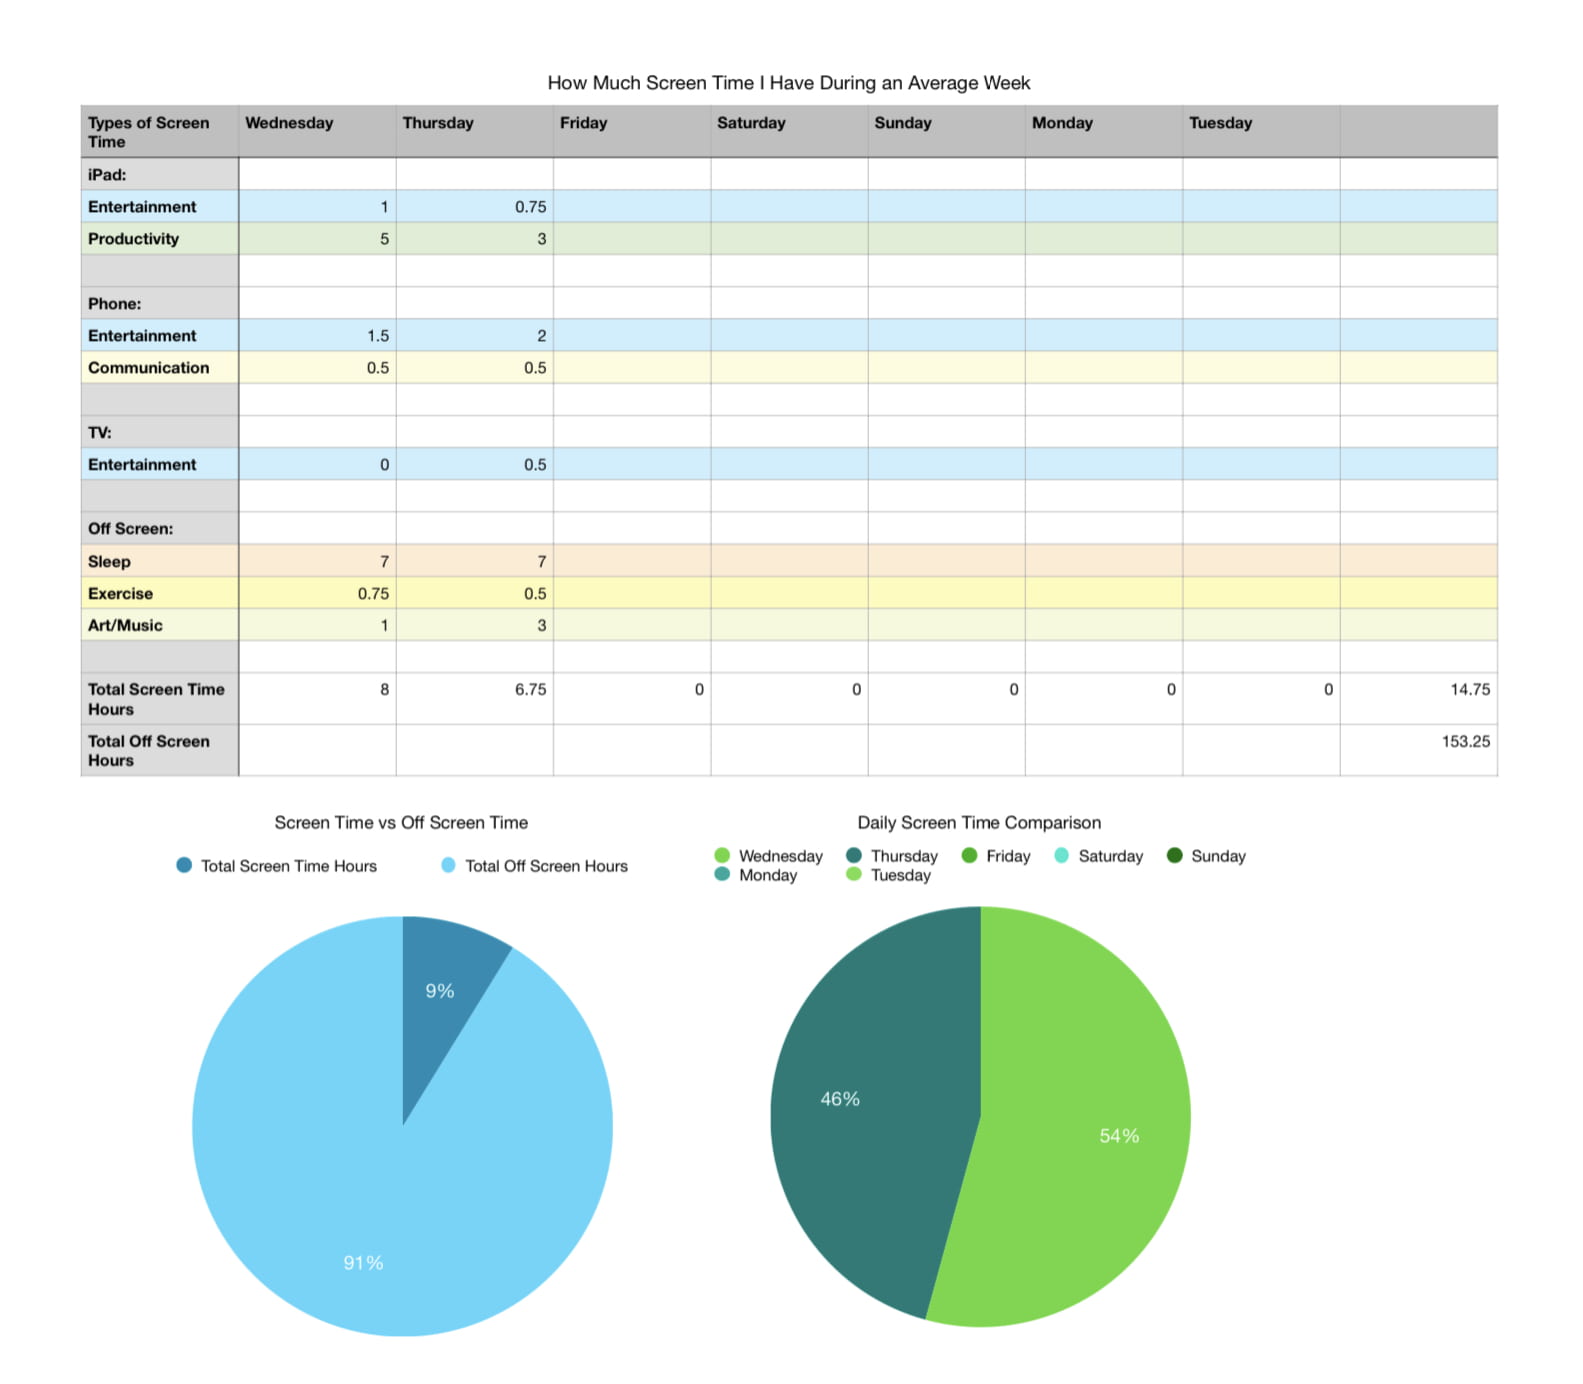
This was the first draft of our Screen Time Spreadsheets. Our teacher, Mr. Gross, walked the class through how to make a spreadsheet and various graphs using Numbers on our iPads. It was fairly tricky at first, but I feel like I’ve gotten the hang of it.
MILESTONE 5: Numbers Spreadsheet With Pie Charts
 Here is my revised version of my spreadsheet after a few days. I added a few more categories to my spreadsheet along with four pie charts.
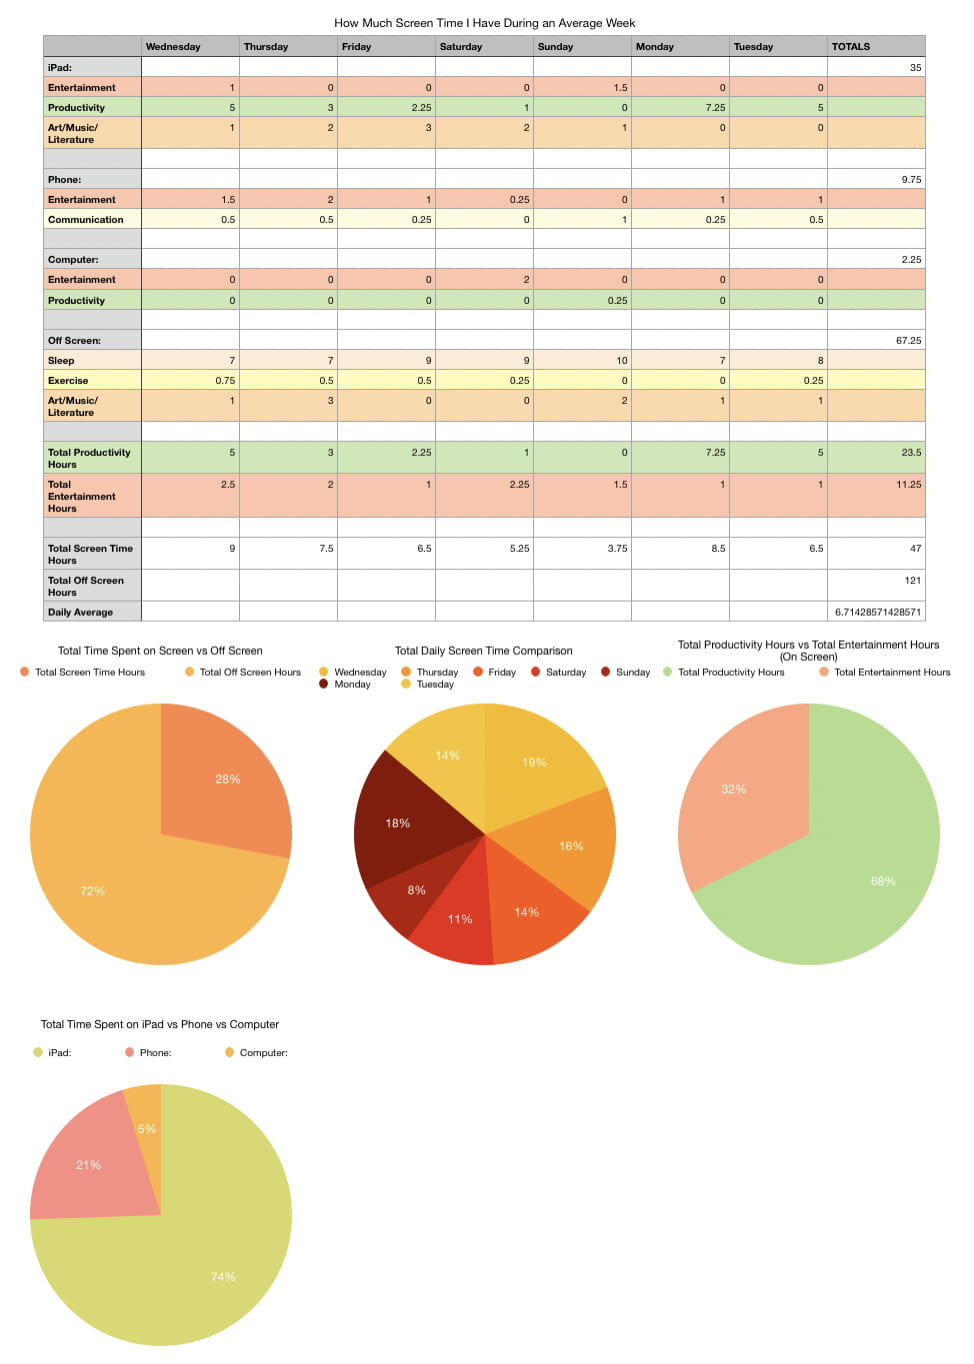
 After receiving feedback from Mr. Gross and making my final changes, this was the final copy of my Screen Time Spreadsheet.
MILESTONE 6: Class Presentation
This was it; the presentation and also the final Milestone for this project. I felt that this was the scariest aspect of the entire project. I’m not especially fond of public speaking, and I’m honestly the type of person who would be anxious about ordering things at restaurants. Even though I could hear my voice quivering throughout the duration of my presentation, I do feel that I did well on it. I tried to keep it short and to the point. The curricular competency for this Milestone was “Applying and innovating: Contribute to care for self, others, community, and world through personal or collaborative approaches.” However, we were given a rubric with all the prior listed competencies as a mark for this Milestone (see below.)
Curricular Competencies
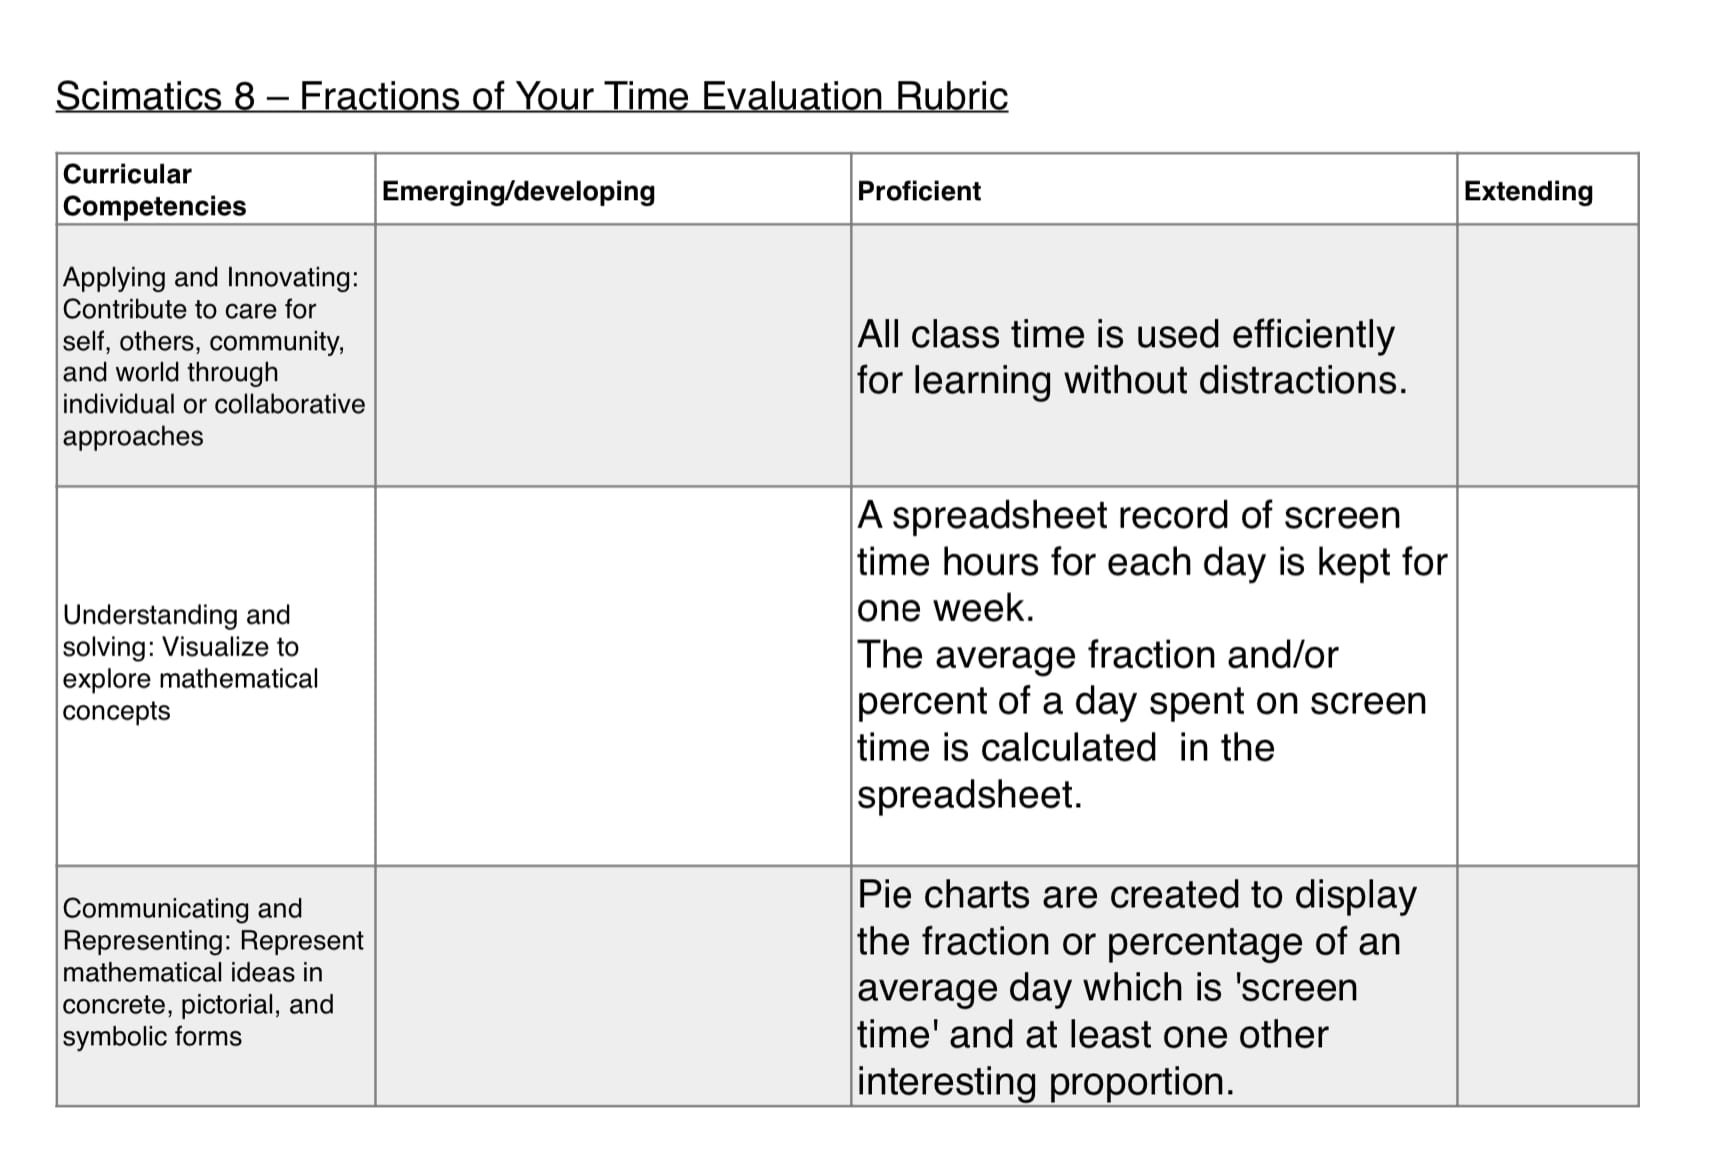 Here is a copy of the Curricular Competencies for this project, as explained in each Milestone, for reference.
I did my best to stay on task during class, and I collaborated with my partner for the first Milestone, leaving me to believe that I have met the first competency.
I carefully explained each graph and its purpose in my spreadsheet during my presentation. My spreadsheet does record my screen time and the average percent of a day spent on screen time, so I have met the second competency.
Lastly, I have included various pie charts in my spreadsheet, showing the percentages of “screen time” and “off screen time”, as well a few other categories. Having done so makes me applicable for the third and final competency.
CONCLUSION
To my surprise, after I finally completed filling out the data in my spreadsheet, 47/168 of my week (47 hours) is spent doing tasks on various devices. I find it quite overwhelming that numerous hours of my life is being spent staring at a screen. Although, I suppose it can’t be helped considering the day and age we live in. Even though looking and analyzing your screen time can be overwhelming or even embarrassing, I strongly encourage others to do so.
As we’re entering an era where technology is quite advanced, it’s important to remember that there’s more to life than what meets our eyes.

Leave a Reply