
Hello there everyone and welcome to another reflection post! Not much time has passed from my last reflection post, but I’m excited to announce that our class has transitioned to another quarter with new subjects!
In today’s post, I’m going to reflect on my first project in our Scimatics class… Fractions of Your Time!


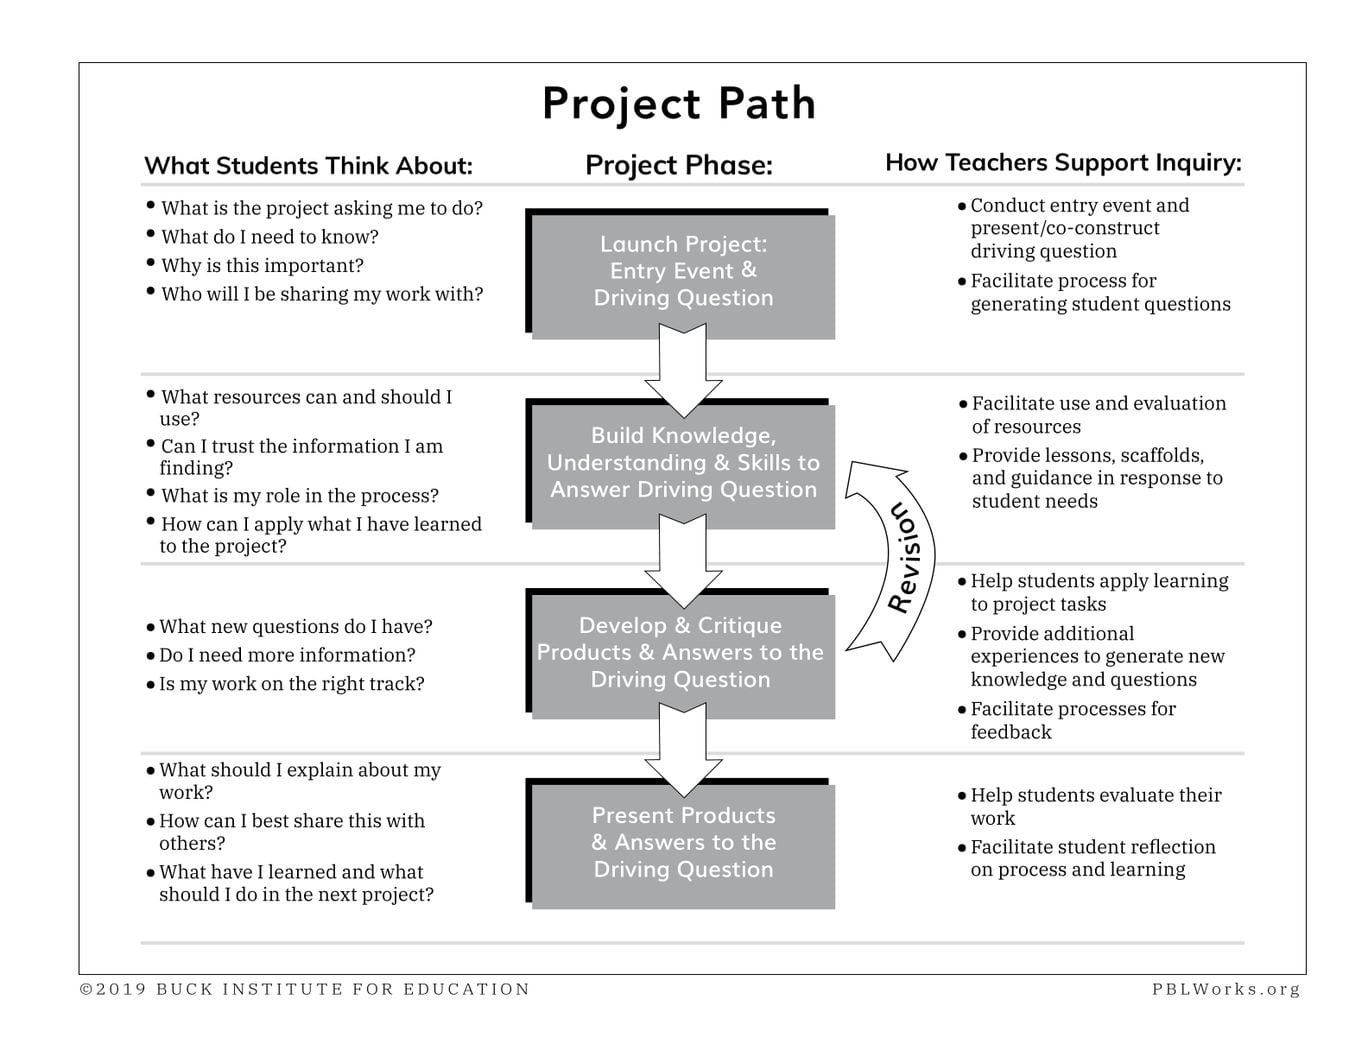 As I do with all my other reflections, I’m going to start this one off with THE PROJECT PATH. If you didn’t know, the project path is the general outline of our entire project, and we base our assignments off of it.
In case you’re not familiar with it, the project path consists of 4 major steps; “Launch”, “Building Knowledge”, “Develop and Critique”, and “Present and Reflect”. Within those major aspects are both milestones and stepping stones, which are assignments that help us complete the project.
 Let’s begin the LAUNCH phase by going through the main focus or assignment in this project. I’d also like to mention that unlike our most recent project (the Medium is the Message), this one was done individually.
Our objection for this project was to create a spreadsheet that shows a record of our screen time over the span of one week. We then used the coding/cell option and some graphs/charts in Numbers to calculate our the percentage of an average day on which we spent on screen time.
Here’s the rubric:
 Before I present my final product, I’m going to dive you through the steps we took to get to this phase in the project.
 For milestone 1, we brushed up our rusty math skills through a short assignment called, “Whiteboard Fractions.” Here we were separated into small groups of two and tasked to write fractions from the physical attributes some people share.
Here’s some examples:
- The number of people in the class wearing something white
- The number of people in the class with dark hair
- The amount of the school year that has passed
Reflecting on this singular assignment, I believe that I could have done better. Let’s just say my brain wasn’t working that morning and I thought that fractions could contain decimals.
At least it looked a little visually appealing (but not really)

Anyways… let’s move on.

 Whoohoo! It’s time to reflect on the portion where the most learning occurs (well, at least in my opinion…) Here comes my favourite part of the project path… BUILDING KNOWLEDGE!
Let’s start this portion off with some vague reflections on all the learning I personally achieved through these stepping stones, which also helped me develop my skills in this area.
First, we reviewed on how to show fractions through different visuals while using the Fractions Intro Simulation to help us along the way. We filled out a couple of tables and observed on how to use this website as a valuable tool through a work page (which we completed through notability.)
Here’s my work: phet-fraction-intro-student-handout-1.pdf
We also reviewed on fractions, decimals, and percents, which really helped us understand what we were creating through the spreadsheet. We filled out another work sheet, and I found this particular stepping stone to being very enjoyable.
Check it out here: fractions-decimals-and-percents-practice.pdf
Meanwhile, we yet again completed lots of mini stepping stones through these short assignments (we even used digital textbook pages for some of them.)
Now, let’s continue on to the next milestones…

In both milestones 2+3, we were to complete some quizzes. Although these quizzes will not really reflect in our overall grade, we used them to review and get some feedback on our overall understanding of the work we completed through our worksheets.
Although I am not showing my test results on this post for privacy reasons, I believe that I did quite well in these milestones. I feel accomplished in these areas, and I got a good understanding of the math strategies.


It’s now time to show the final results of my spreadsheet!
Here it is: screen-time-tracker-2020-scimatics-8-1.numbers
I’m pretty happy about how it turned out, and I’ve learned a ton of new things and how to use some other accessories in the Numbers app. Of course I’ve dabbled with it before with our Launch Journal in the last project, but I didn’t know you could code within it.
First off, we created the actual spreadsheet, and started a new chart. We then labeled the headings and inputted the data we already had. We also had the option to change the colours of each box, and label more subjects to track, such as “Sleep.”
Then we coded the chart to record and calculate the summative totals of each day for us. We also used it to calculate the total non-screen time as well!
Finally, we created some graphs from our data, and the numbers app calculated the percentages for us.
This was a great learning and reviewing experience, and an overall awesome start to our Scimatics period. It gave us a feel of how this unit may go, and we learned some cool skills in Numbers as well.
I’m really excited to continue with this quarter!

Through this project, my goal was to reach an accomplished phase within the curricular competencies… here’s my overall reflection on whether I believe that I’ve done that.
Here’s the rubric (that I showed at the beginning of this post), which contains the expectations for each of the competencies:
Let’s begin with the first competency…
APPLYING AND INNOVATING:
This skill is reliant on whether I spent my class time efficiently for learning, and if I worked well with my peers. I believe that I’ve reached an accomplished stage with this competency, but I can always improve.
For example, I always use my class time for work only, and I try my best to stray away from getting off topic. During assignments where I have to pair up with a group (Whiteboard Fractions) or if someone approaches me, I’ll be happy to help and contribute.
However, I’m not that good with communicating with my peers on my own terms. I normally stick to myself, and I don’t really approach anyone for help, critique or advice on my work.
I believe I can definitely improve through this area, and get some confidence to show care for not only myself, but for others in my community as well. I’m hoping to someday get the initiative to actually talk to others that I don’t really know well, on my own accord.
UNDERSTANDING AND SOLVING:
This competency depends on whether I comprehended the math concepts and if I solved them with accuracy and understanding. From my point of view, I believe that I do understand the math, and it helped me throughout creating the spreadsheet.
An example of proof that this competency has positively affected my learning is that my calculations of screen time that is shown on the spreadsheet is accurate. Also, I made sure to record the results daily, and that the way I formatted it was clear and easy to follow.
I even calculated some of my results in fractions, and I attempted to make it clearly presented in my spreadsheet.
If I were to redo this again, and improve in this competency, I would probably decide to make all my percentages into fractions as well. This way, there can be both mediums of fractions and percents, and it could help viewers further visualize my data.
COMMUNICATING AND REPRESENTING:
This competency is whether I added charts that clearly represented my data, if I added more proportions to track, and if my spreadsheet was easy to read and understand. I believe that I did quite well in this competency as well, but like always, I do have some room for improvement.
I created lots of eye catching charts, graphs, and visuals to represent my data. Like I said in my presentation, “-And here’s more graphs, because I like graphs. Graphs are cool.”
I also tried to colour code them according to the days of the week. My chart and all my graphs are organized and have a specific colour scheme to make it more visually pleasing. I think this really shows that I represented my data clearly through many visuals.
Like many other people, I added some more proportions, but I think I could’ve added some more. Mine weren’t that interesting, and there wasn’t that many (I’m a very boring person lol). Besides that, I think I did a good job in this competency as well.


The driving question for this project was, “What fraction of our time is screen time?” Turns out about 3/10ths or 32% percent of my day is spent on screens, and 68% is non-screen time (that’s not even including sleep time!)
I was originally shocked and was in disbelief at the amount I’ve spent on devices. This pandemic has only increased that amount since I spend more of my free time indoors, and there’s less things I can do.
I’ve discovered that I spend quite more time on screens that I had originally thought, and I should probably be more aware of how much time I use on them. This project made me more aware of myself and how I spend my time. I need to probably put limits, and try to have less screen time in an average day.


(gosh this took awhile to write. my headache is not permitting me to write a coherent sentence lol.)
Gifs are from the following sources:
Star Wars: Attack of the Clones


November 29, 2020 at 3:43 AM
“And here’s more graphs. Because I like graphs. Graphs are cool.” I literally snorted when you said that during your presentation, haha. Nice reflection!
November 30, 2020 at 12:22 AM
Lol thanks! Graphs are the best 😎