
If time is money, when do I get paid?
There’s no denying that we’ve all had “dream jobs.” Ones that we’ve kept for years, which tend to be on the unrealistic side like a fairy princess chemist… or just a palaeontologist (6 year old me was obsessed with dinosaurs… I think I’ve mentioned this before.)

However, how do we determine whether or not this “job” can sustain us? Do we consider the availability, demand, (and paycheque) of this occupation? Will the job die out in the future, possibly due to growing environmental concerns?
Is our dream job just… unrealistic? (I apologize to my 4/5 year old self who wanted to be fairy princess chemist.)
Well… the answer is quite simple actually.
It’s MATH.


It just hit me that this is the last scimatics project I will ever complete (and the last blog post of grade 9.) I guess I’m feeling a bit sentimental, because I’ll definitely miss it. AND I’VE FINALLY GOTTEN GOOD AT COMPLETING THE WORKBOOKS, DARN IT!
However, my math skills really need help. Jeez, I’m so rusty. We haven’t done math since September! I guess I’ll suffer in calculus next year…

If you didn’t notice from my lengthy opening, this project is all about making money. I guess I know a thing or two about that, because I’ve babysat for my neighbours (which includes watching a movie and making sure the children don’t die for a couple hours.)
(Surprisingly, babysitting DOES NOT mean sitting on the babies.)

Anyways, since we’re getting older, we have to learn “the art of finding jobs.” As money typically associates with math, we also had to revisit linear graphs.
In other words, we had to kill two birds with one stone.
Our assignment was to create a hypothetical business, and make graphs to see if it can be a sustainable job. We also had to keep the environment in mind, since climate change is becoming more prominent in our society. (…and it’s a chance to learn about science as well?)
With that out of the way, let’s get started!


Guess what. We didn’t make a mind map for this project.

If you don’t read my scimatics blog posts and don’t know what a mind map is, then you deserve to be confused…
If you’re a true high ground master (and you read my posts), then you know that we always make mind maps. It’s simply atrocious that we didn’t make one this time around.
Instead, we pitched our business ideas:

If you know me (or stalk me on the internet), then you would know that I love art. I want to be an animator/art director when I grow up. I’ve also seen some art commission sheets floating around instagram, and I’ve been dying to make one.

Then, we actually had to create the products and insert the required values into a table. This included the time it took to make it, the cost of the materials, the start-up cost, and the price of the service/item.
I decided to draw a portrait of one of my characters (she’s from a webcomic idea that I might make one day), and then have different prices for full colour, line art, or sketch. Last minute, I also decided to add a painted, semi-realistic variation which was not of that character. I made the price higher since it took more skill and time to paint it.


Looking back, I wish I made my examples more consistent, and that they each portrayed the same character.
Anyways, here’s my spreadsheet:

Meanwhile, while we were starting up our fake business, we also had to complete math workbook pages and some Khan Academy quizzes. Since I was very rusty at math, I soon discovered that I could not remember how graphs or algebra worked. I had to bug my parents to “enlighten” me on the subject.
Once I got back into the swing of things, it was much easier (and more fun!) Over the summer, I’m planning to practice my math skills and prepare for next year. I’m terrified of calculus and the “numeracy exam.”
In the end, I managed to get good scores on the quizzes and I’m very proud of myself 😎

We read some textbook pages on the food chains, water cycles, and some other environment stuff. It seemed out of place, but it allowed for the creation of THESE GORGEOUS MASTERPIECES:


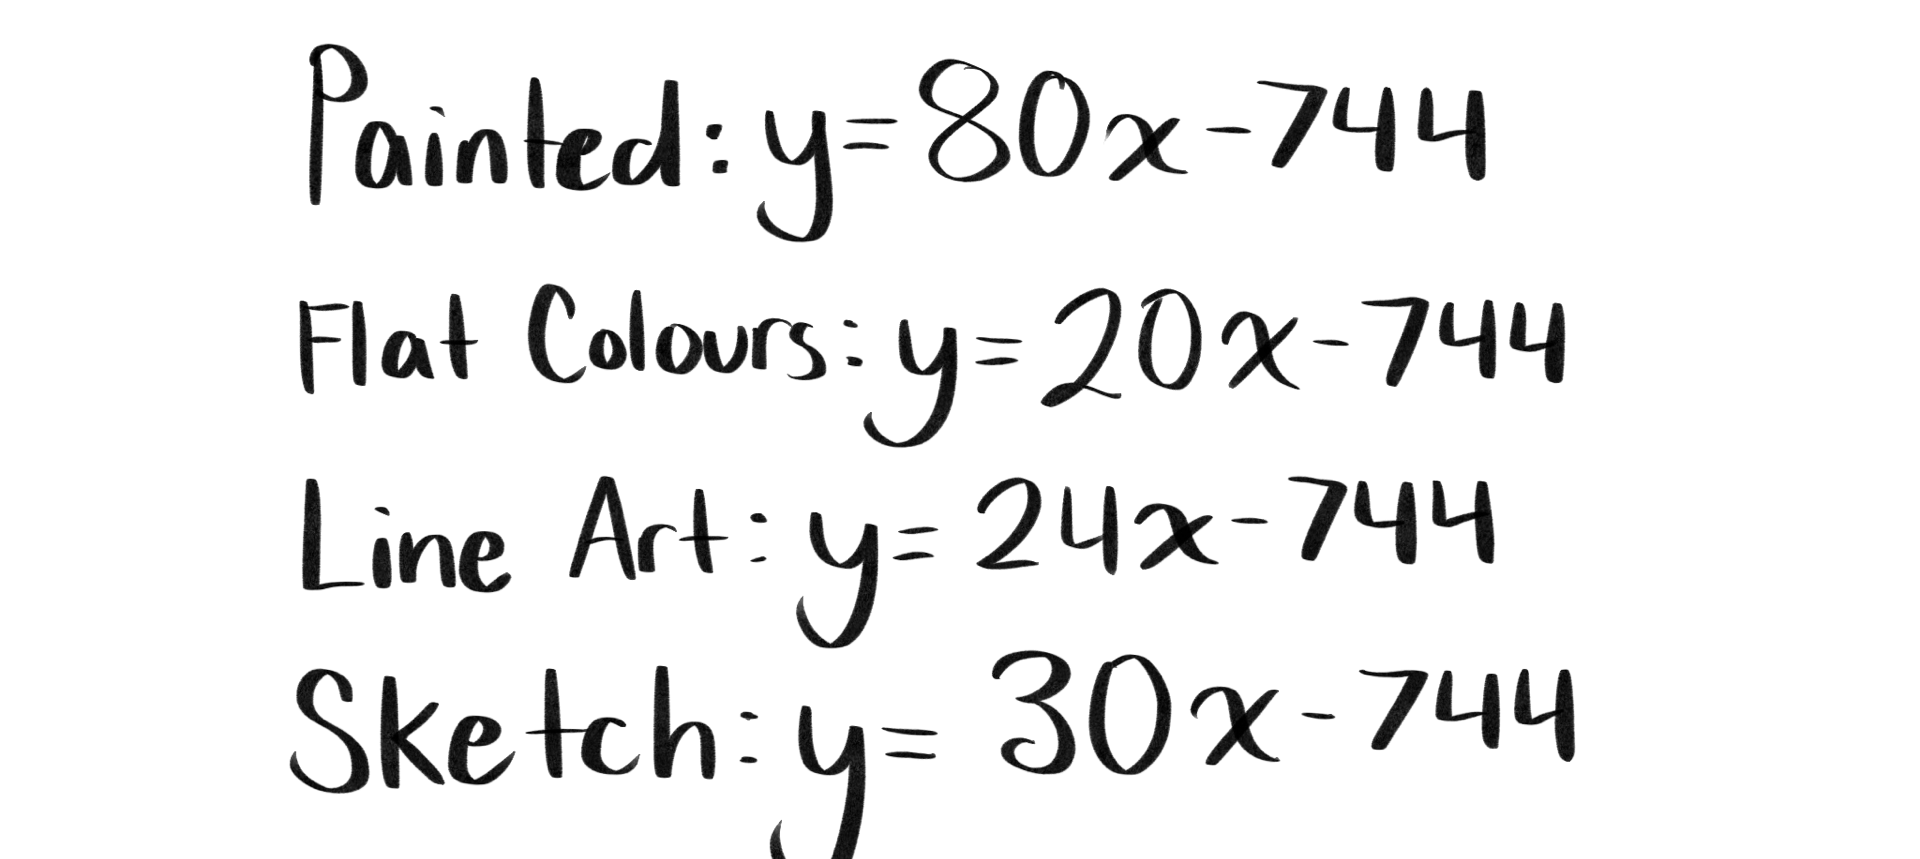
With our knowledge of math, we were ready to move on to the next step: creating the equations for our graphs. To do this, we took the information in our spreadsheet and put it into the equation y=mx+b OR RATHER y=(saleprice-expenses/time)x + b.
To be clearer…
‘Y’ represents total earnings
‘x’ represents time (hours worked)
‘b’ represents initial start up costs like equipment, since it is a COST it will be a negative number.
‘expenses’ are materials that are used up every time you make ONE product or do ONE service
‘time’ represents the time it takes to build ONE item or perform ONE service
‘saleprice’ represents the the sale price of ONE item or service
(I totally did not copy that from basecamp.)

Here’s my equations:
And with our equations, we were able to create our graphs and complete our videos. If you scrolled past my video (which was at the top of this post), here it is again…

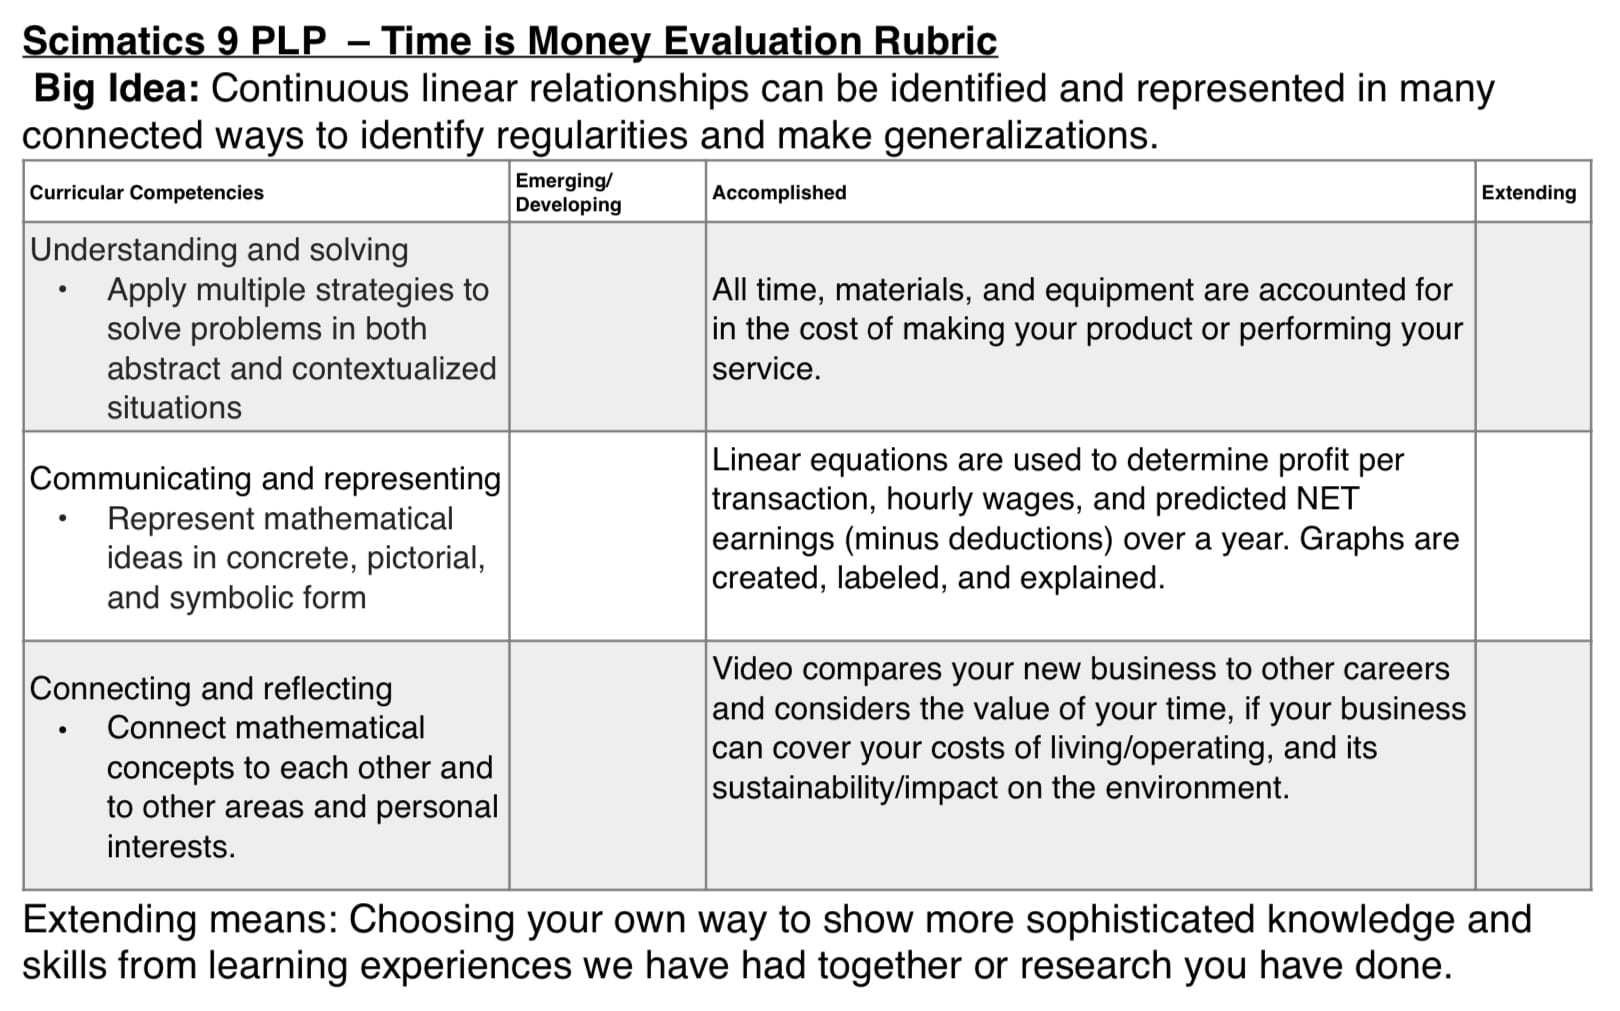
Understanding and Solving:
Looking back, I believe I’ve accomplished this competency. In order to achieve it, all time, materials, and equipment must be accounted for in spreadsheet. Since I recorded the data, I was able to create an accurate graph and equation for my business.

(I just, REALLY like this gif. This is like the 10th time I’ve used it this year)
Although, if I were to do this again, there are some areas in which I can improve. Obviously not all the art commissions would be the same. Some may be more complex than others or require more work anatomically. Since time is a factor and I don’t have different rates depending on the complexity, it might vary based on the commission. Therefore, my graphs can be flawed.
Also, if I were to extend, perhaps I could analyze the demand for my business and estimate the rate I would receive commissions.

Communicating and representing:
This competency requires that my equations and graphs are correct and understandable. I think I’ve managed to accomplish this as well. However, I do have room for improvement, and I might have forgotten an aspect of this competency in the final video.
In my video, I predicted my NET earnings, and managed to figure out how much I’d make in a year. I also vaguely estimated how much I’d earn based on demand, which I could have improved (through more research) to be more accurate.

Despite explaining the graphs, I forgot to label them in the final video (since I had created them in Desmos and used a screen recording of the graph.) I could have also included more predicted earnings, such as for a week or a month.
In the end, if I were to redo this project, I could improve.

Connecting and Reflecting:
I believe I’ve also accomplished this competency, but I could have added more information to my video to extend it.
Although I did compare my business to another art related career, I could have found one that was more specific. Animation is completely different! It would be more accurate if I were to compare it to the income of a professional concept artist.
(Me in the future as a broke artist)
I also think I could’ve researched more on the environmental aspect, because I wasn’t very clear in my video.
Overall, this competency lacked more than the others, and I could do much to improve.

“How can we predict our finances for the future?”
Through this project, I’ve discovered that the answer is math and lots of graphing. If we took the time to calculate our services (such as time, cost, etc), then we could easily predict the prosperity of our business/job.
However, if it’s something reliant on a constant stream of customers or uncertain variables, then it gets harder to estimate an accurate answer.
Although the future is uncertain, these graphs can somewhat predict a possible trend. I’ll definitely use them more often in the future.

Thanks for reading my last scimatics blog post AND the last blog post for this year. I’m super excited for summer (and tonight’s Kenobi finale! NO SPOILERS!)
Anyways, see you in grade 10!


Leave a Reply