Have you ever heard someone talking about correlation vs causation? Perhaps in the latest season of Manifest on Netflix? Well that was the topic of this project, correlation vs causation.
Driving Question
How are correlation and causation different?
Causation is when A causes B or vice versa. It could also be when factor C causes both A and B. Correlation is when there is a relationship between A and B but there doesn’t necessarily have to be causation.
Project Overview
In this project we were to create a survey and video or formal presentation that compares a correlation with no causation and a correlation that does have a logical explanation of causation between the variables. We used numbers to create graphs to show the data that we collected from our surveys. This was also a partner project where we would be collaborating on creating a single project with our partner.
Project Start Mind Map
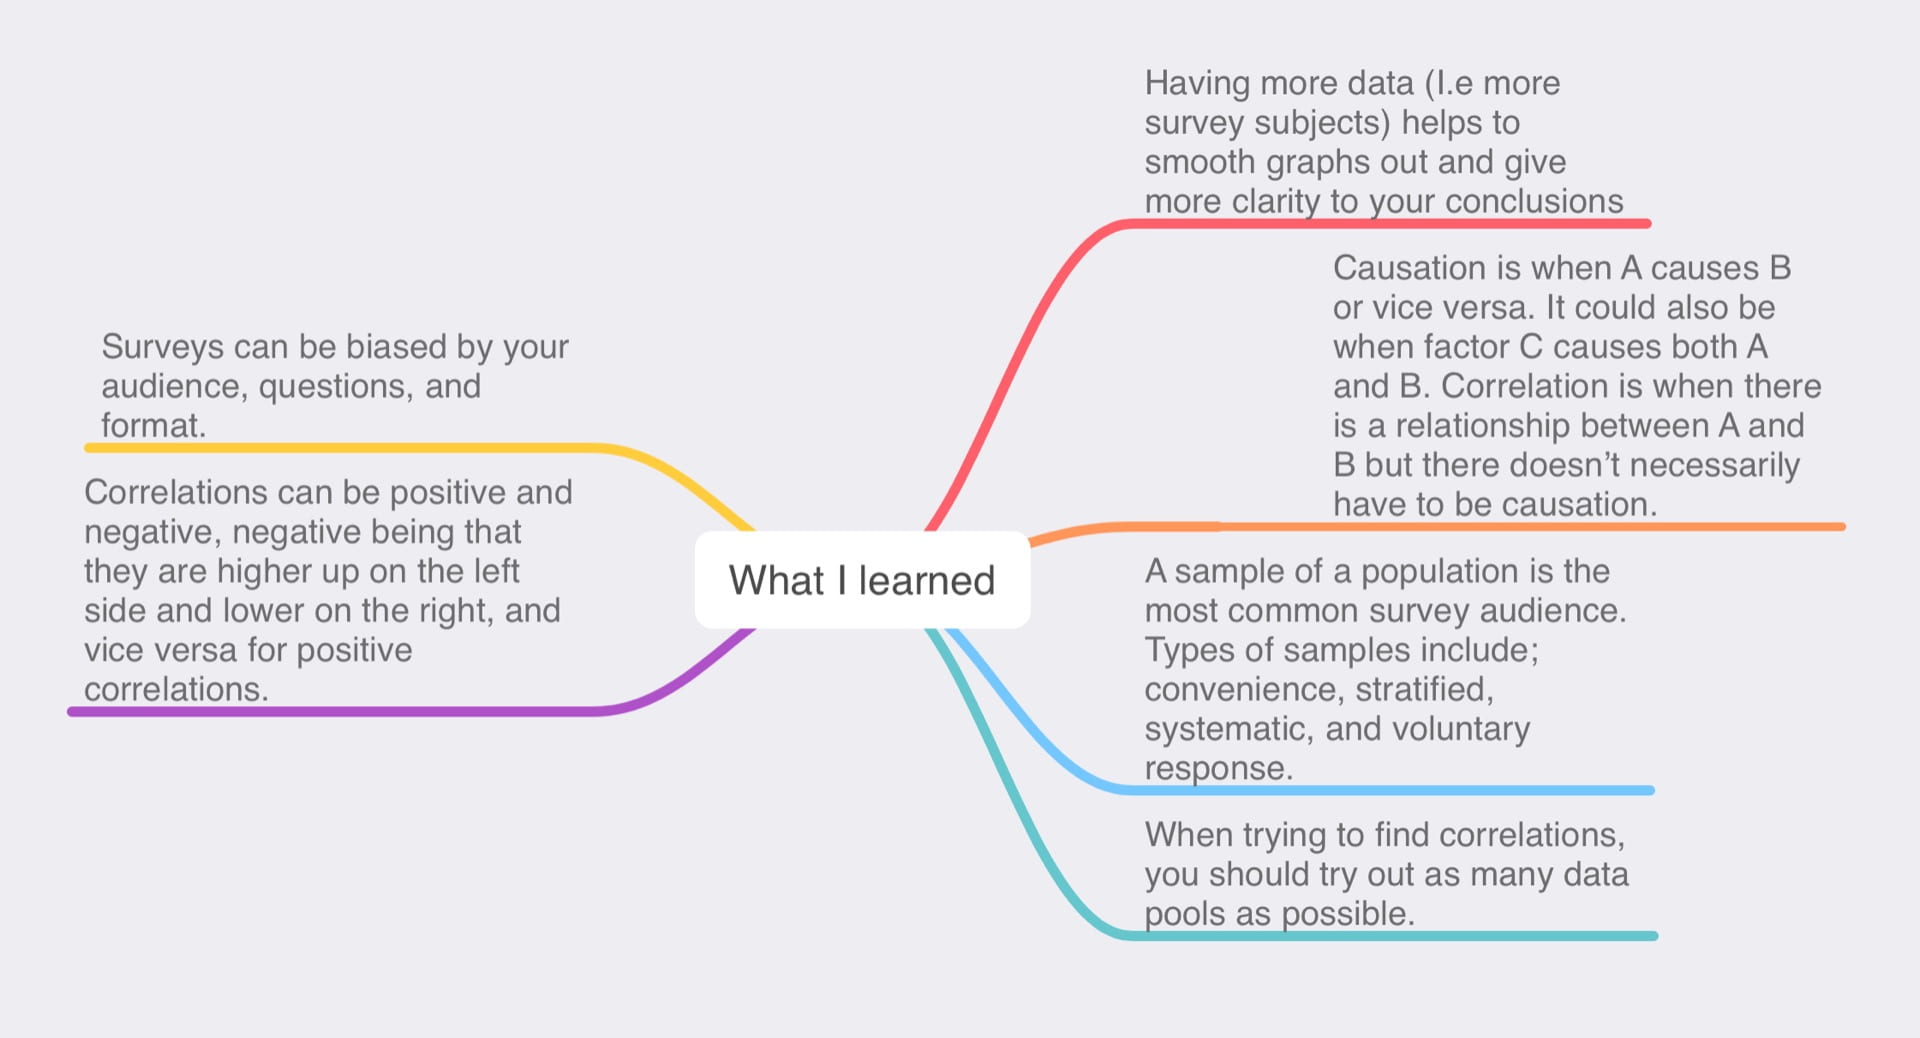
As per usual we started the scimatics project off with a project start mind map. I put in any questions I had for the project, what I already knew about correlation vs causation, and any ideas that I had for survey questions.

At the end of this project we also added to the mind map a section about what we learned from this project.
The Project
I think that the best way to show you the bulk of our project is by the keynote presentation that we presented to the class. The presentation included information about our survey audience, our graph results, and our definition to the driving question. Here is the link:
Curricular Competencies
Planning and conducting: Select and use appropriate equipment, including digital technologies, to systematically and accurately collect and record data;
We found at least 3 correlations using our well crafted survey results. The survey results and correlations were displayed and explained through a keynote presentation to the class. We analyzed the graphs to confirm if there was cause for correlation because the line that automatically shows up was often misleading.
Communicating and Representing: Use mathematical vocabulary and language to contribute to mathematical discussions;
We created our presentation with helpful visual aids and well crafted written explanations. We had two main examples where we showed a correlation that we falsely thought would have causation and one that actually had correlation and causation.
Applying and Innovating: Contribute to care for self, others, community, and world through individual or collaborative approaches;
We used good ethics when creating the survey questions and conducting the survey. In class I was very focused and productive. I am very pleasantly surprised with my ability to stay on task while working on this project.
Conclusion
So our correlations were not incredibly strong, but we were able to identify correlations and some causations in our graphs. We also found this project fun and it expanded our brain cells. I really enjoyed working with my good pal Dana and I hope to work with her again soon.
As always, Brooke.