Welcome to the second project of Scimatics 2021. This is this is my recap of the Correlation v.s. Causation project. The driving question for this project is: What is the difference between correlation and causation?
I will answer this question at the bottom of my post. For this project me and my group had to create a survey and using the results, create graphs that show the difference between correlation and causation. We were also tasked with making a presentation and presenting it to the class. My group members were Ben and Noah.
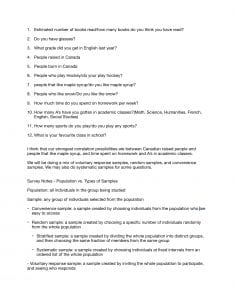
Here is the survey we made. Feel free to take it, we are interested to see your responses. Most of the questions are targeted towards high school students.
This is how me, Noah, and Ben created our survey, graphs, and presentation.
I think that if I were to do it again then I would divide the work more evenly.
I think that the presentation represents my learning appropriately and I am very proud of how it turned out.
The Curricular Competencies for this project are:
- Planning and conducting: Select and use appropriate equipment, including digital technologies, to systematically and accurately collect and record data.
This means that two correlations are found using well crafted survey results. The survey results and correlations are are displayed and explained through presentation software. At least two graphs are analyzed to confirm correlation.
I think that we did this well because our survey results clearly showed causation and correlation. I also think that we presented it well so that it could be understood clearly. If I were to do this again, I would find a way to get more people to do the survey so that we could have clearer and more accurate results.
2) Communicating and Representing: Use mathematical vocabulary and language to contribute to mathematical discussions
This means that verbal and pictorial explanations help the audience to understand the circumstances where both correlation and causation are present, and also where a correlation is falsely associated with causation. A Logical explanation for causation is explored for one case
I think that we did this competency well because the video we made explained the information in a interesting way. If I were to do it again, I would do a presentation so that we could explain it a little better.
2) Applying and Innovating: Contribute to care for self, others, community, and world through individual or collaborative approaches
This means that good ethics are followed when conducting surveys. All class time is used efficiently for learning without distractions.
We did this well because our survey was ethical and there was almost no bias in the questions. What I did not do well was I wasn’t always on task. If I were to do this again I would definitely be more on task.
The steps that I took to make this presentation were:
Milestone 1: Project Start MindMap
For this milestone we created a mind map about everything that we knew about cause action and correlation, as well as some questions we had. Here is mine

Milestone 2: Correlation Number Template
For this milestone we filled out a numbers template with everyone in the classes hand size and height. We then looked at the results to see if there was a correlation. Here is mine

Milestone 3: Survey Plan
For this milestone we created a plan for our survey of the questions that we were going to ask. We also wrote some definitions of types of surveys. Here is mine
Milestone 4: Correlation Graphs
For this milestone we created graphs showing correlation using the survey results that we got. Here is mine

Milestone 5: Presentation Outline
For this milestone we created an outline of what our presentation was going to look like. We decided that ours was going to be a video, and here is our script. The letters of our first names are the people saying the lines in the video.
Presentation Outline
Intro
B: Hello, my name is Ben, and today my group and I will be showing you how to identify correlation from causation.
C: We will also be showing you some data we collected from a survey that we made.
Survey info
N: We made a survey that asked a lot of questions, but we only used some of them.
C: The people who did the survey were asked the following questions.
B: They were asked how many books they’ve read, whether they have glasses or not, what grade they got in English, if they were born in Canada, if they were raised in Canada, what sports they play, whether they like the snow, if they like maple syrup or not, how much time they spend on homework, how many A’s they get in academic classes, and what their favourite class in school is.
C: 35 people completed our survey, which gave us a lot of information to work with.
Two Correlations
B: From the information we collected on the survey, we found two correlations and one causation.
N: The correlations that we found were similar, and they both included the amount of books that you have read and your grades.
C: The first correlation we found was between how many books people have read and their grade in English.
B: The results looked like this:
N: Another correlation that we found was between the amount of books you think you’ve read and the estimated percentage of A’s in your academic classes.
C: This data shows that the people who don’t read many books tend to have worse grades in both English and overall academic classes.
No causation
B: We do not believe that this is causation, but rather a correlation.
N: This shows that people that enjoy reading more have a lifestyle and determination that leads them to get better grades.
C: these characteristics exist together and are related, but don’t cause each other.
Causation
B: Our causation graph looked like this, and was about being born in Canada, and liking snow.
N: We think that this is causation because people that were born in Canada were in colder climates for most of their lives, and therefore like the snow more.
C: We think the numbers show that people born in warmer climates may not like the snow as much because they aren’t as used to it.
B: This is causation – people’s opinion of snow results from their place of birth.
Conclusion
N: The type of survey that we did was a voluntary sample questionnaire, and there might have been bias in the results because there were a lot of “I don’t know’s” so we ended up with little useful data.
C: Correlation is when two data points are related to one another (like reading and marks) and causation is when one data point influences the other, (like the cause and effect of birthplace and liking for snow).
B:In this project we learned more about correlation and causation, and we learned more about our classmates.
Milestone 6: For this milestone we made a video explaining the results we got from the survey. Here is that video.
Milestone 7: For this milestone we made the blog post which I am doing right now.
As the answer to the driving question, correlation is very different than causation because of a clear difference that is difficult to define. Causation is two data points following the same pattern because of each other, and correlation is two data points following the same pattern because of an unrelated thing, or complete coincidence. The two things are difficult to differentiate because they can look completely identical. This is why people often confuse them and false information with false data to back it up is spread.
I learned a lot about how to conduct a survey ethically, and how to identify correlation from causation in this project.
Thank you for taking the time to read my blog, and have a great day.

Leave a Reply