Hello everyone!
Welcome back to another blog post that is keeping you up to date about my school projects. So, for the past few weeks, me and my partner Brooke have been working on a correlation and causation project. I found this project fun and enjoyed working with Brooke who is one of my good friends.
Driving Question: How are correlation and causation different?
Answer: Causation is when A causes B or vice versa. It could also be when factor C causes both A and B. Correlation is when there is a relationship between A and B but there doesn’t necessarily have to be causation
This project started off with a MindMap as most Sciamtics projects do. I think that this (as usual) was a good way to begin because it showed me when I already knew. It was also helpful to see where I had gaps in my knowledge and where those would need to be filled in throughout this project.

Next, after we started to learn more about what correlation and causation was, we put together a survey to send to people. We chose to do a convenience sample because then we could send it to anyone was we were friends with or who were easily accessible. After we hand picked some of friends, we added them all to an iMessages group chat. We took and equal amount of PLP 9 girls and Non-PLP 9 girls. We wanted to see if there would be any difference between the to populations. When we got our data back, there wasn’t a significant difference in the two populations. We then tried combining the data, but that didn’t end up helping. It was a fun experiment though.
After we sent out our survey and got our data back, we put it all into graphs. We used a pre made Numbers template and inputted our data. It then put the data points on a graph and drew a line through it for us. That was pretty ✨snazzy✨ because we didn’t really have to do any work besides type numbers.
Here’s what all of our graphs put together look like:


After this, we made a presentation outline. We had to include the following things:
-Introduction (correlations that you attempted to find)
-Survey information (population/sample, stratified, convenience…)
-Survey questions
-2 correlations with supporting data and graphs
-Identification of no causation with supporting logic for one correlation
-Identification of causation with supporting logic for the other correlation
-Conclusion that explains the difference between correlation and causation
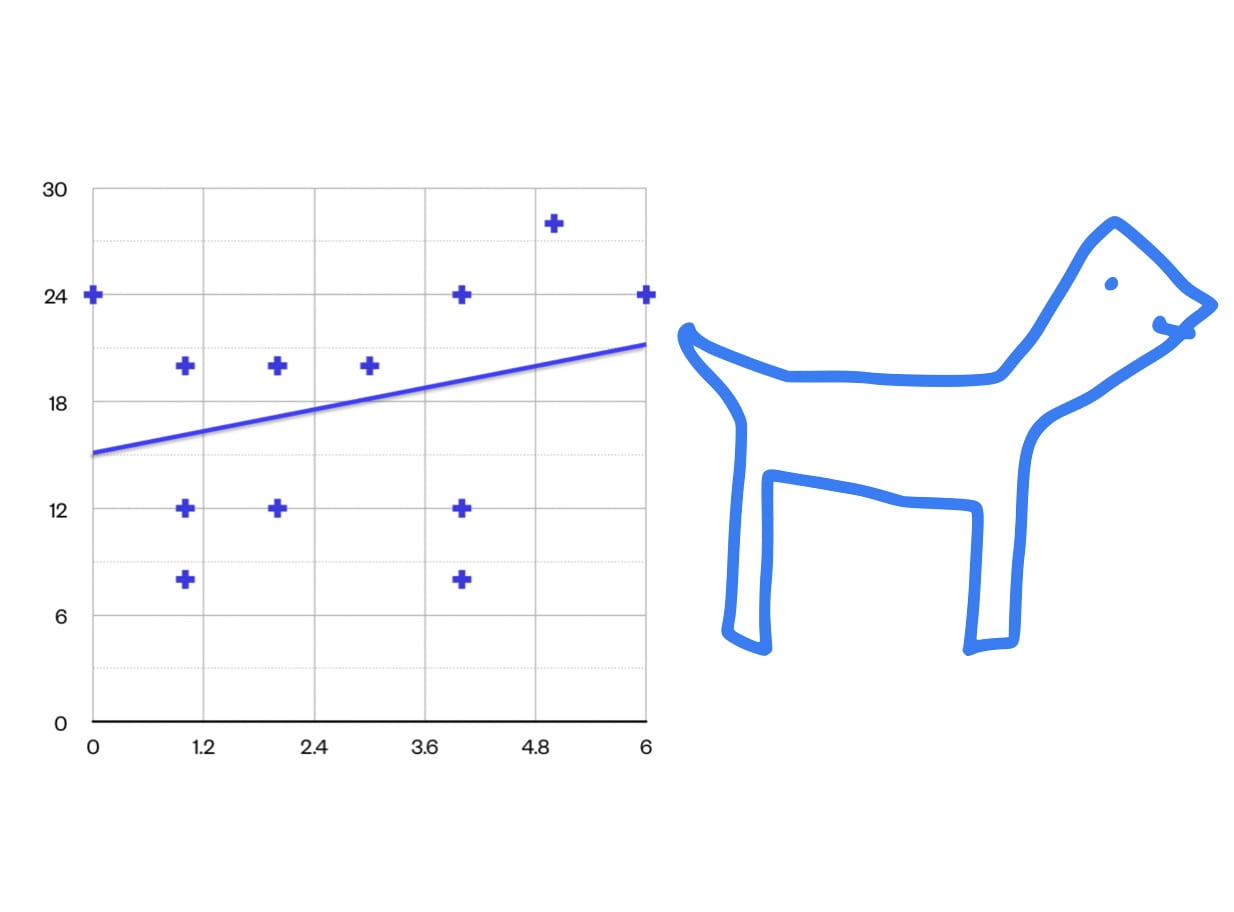
We then handed in our presentation outline making sure that we had put in all of the criteria. After that, we made a final presentation in Keynote. We had some memes, animations, and a special appearance from Harold who Brooke drew based on one of the graphs.
Harold:
After we made our final presentation, we practiced for a while then we presented it to the class. The presentation was a Milestone and I am proud to say that we got a 🌈 on. I honestly think that Harold was the star of the show, but that’s just my opinion.
If you want to take a closer look at our presentation click the link below:
Curricular Competencies:
Planning and Conducting:
I think we very well on this. We had over six correlations and we found over 4 causations however we only explained two in our final presentation. We used Keynote in our final presentation and added some animations and pictures into our presentation to add some spice.
Communicating and Representing:
During our presentation, we were very clear with what we were explaining. We were honest with where we could have done better, but we also talked about where we did well in the project. Also, we added in pictures of all our graphs to make it easier for the audience to understand what we were talking about. Furthermore, we identified a causation and presented that to the class as well.
Applying and Innovating:
I think we used good ethics in our survey. I don’t really know how to talk about that since we never thought about asking questions that might have been perceived as too personal. However, for time time management, I’m proud of myself. I was working with one of my really good friends Brooke who I’ve talked about above in this post. Even though I’m really good friends with her, I still stayed on task in class even while we were vibing to Taylor Swift most of the time.
In the end I think that this was a good opportunity to learn some great presenting skills and also learn more about how graph input data works. I also like that I got to work with my friend Brooke and that I got to learn a lot more about correlation and causation. But in the end I really liked the way our presentation turned out. I think that if you look at my final project MindMap at the top of this post, you can see how much I learned over the course of this project.
Anyhow, thanks for reading this post about my most recent Sciamtics project!
Best wishes,
-Dana