Being in PLP we have to do two SCL’s (student lead conferences) a year. Because I am in Gr.8 this year this is my first one. A SLC presentation is about 12 minutes long. 7 of those minutes are for me the student to talk all about the stuff I’ve learned this year and what to do better for the rest. The other 5 are for the parents and the teachers to ask me questions about my work, learning, and presentation.
What I did great

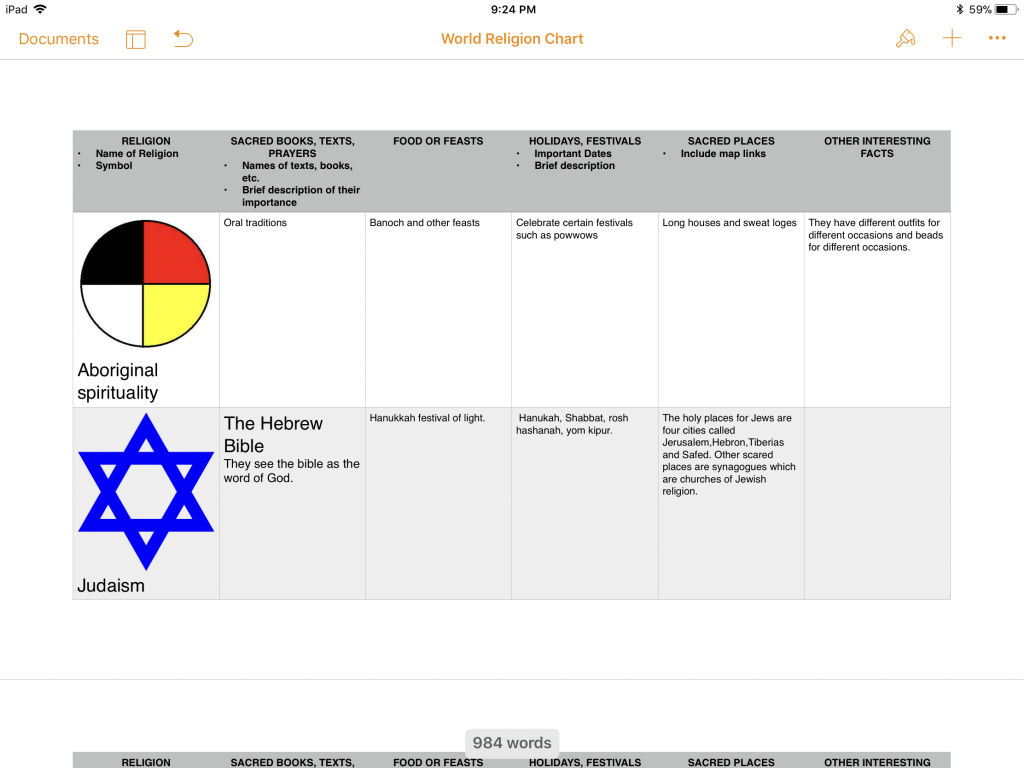
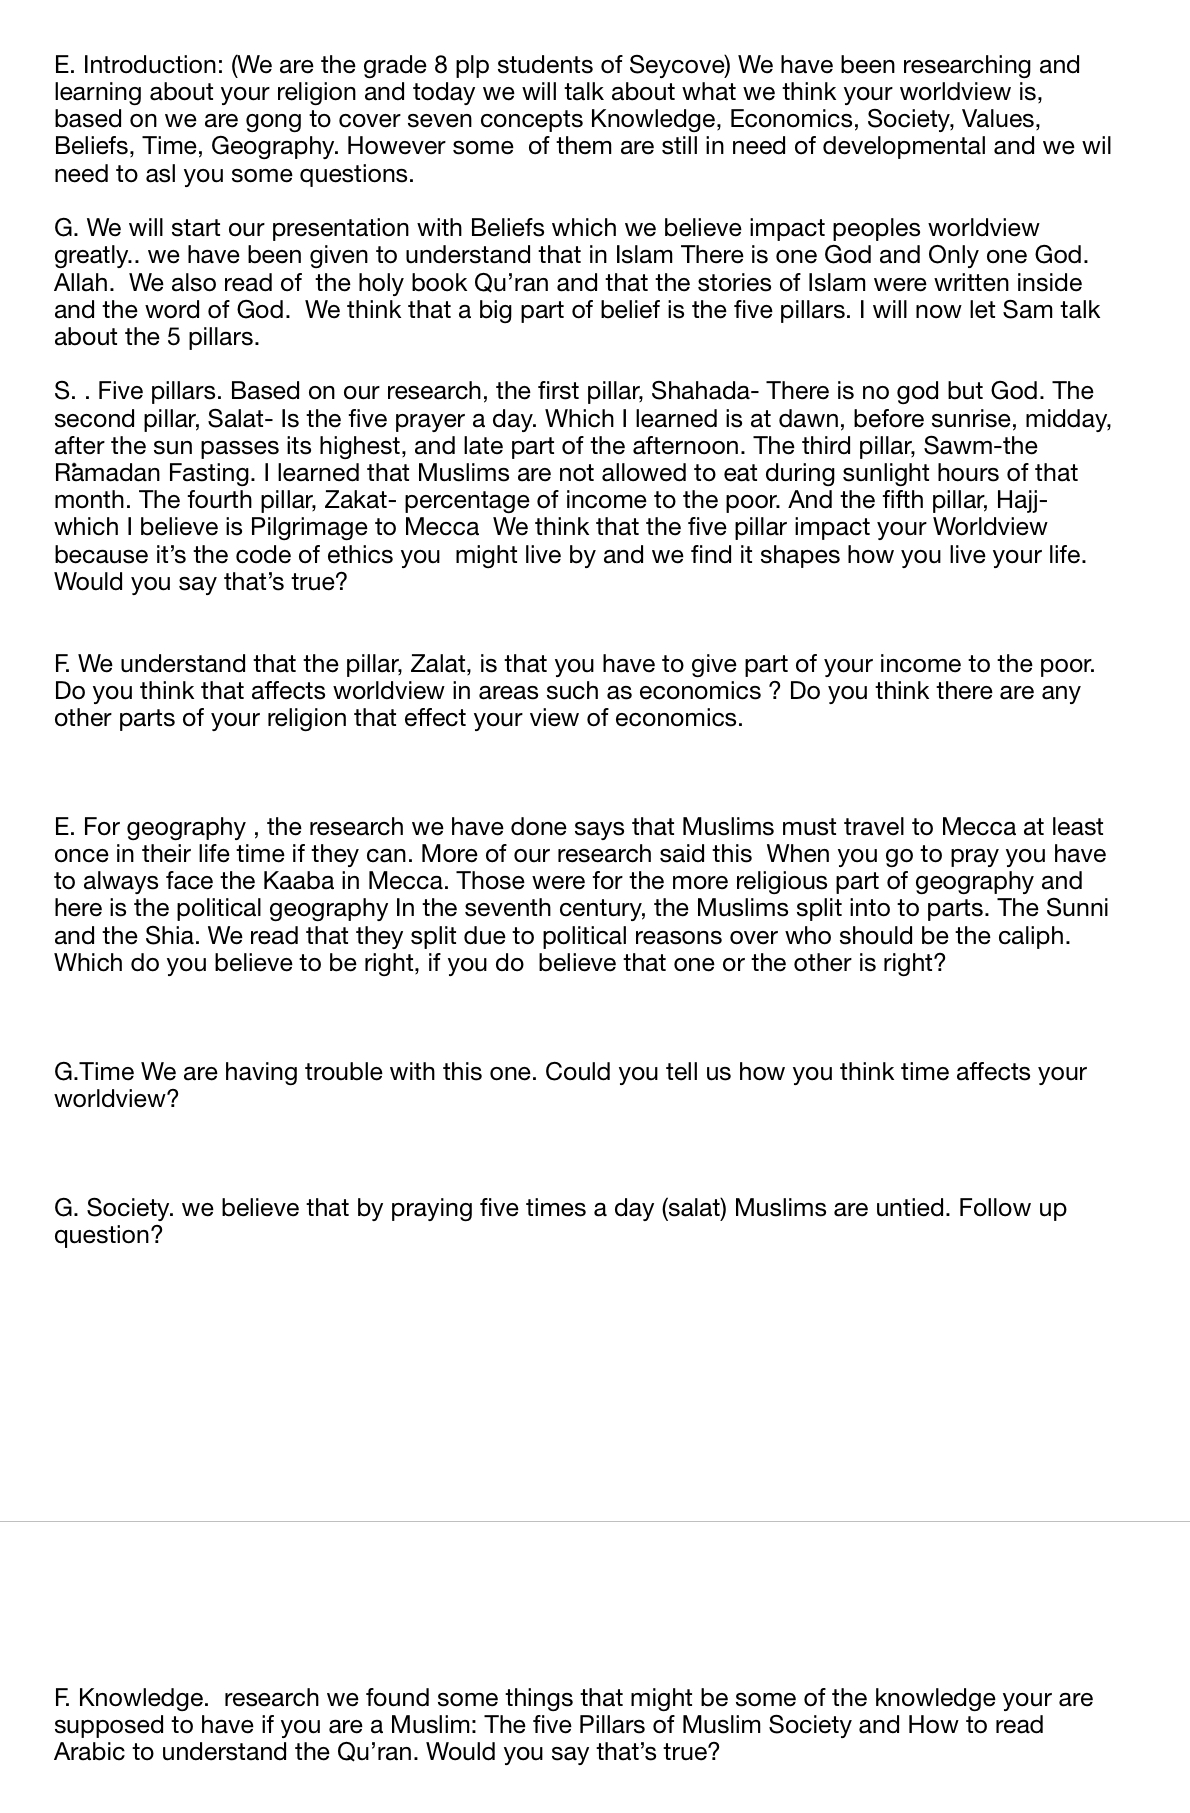
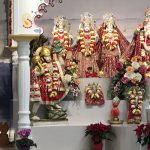
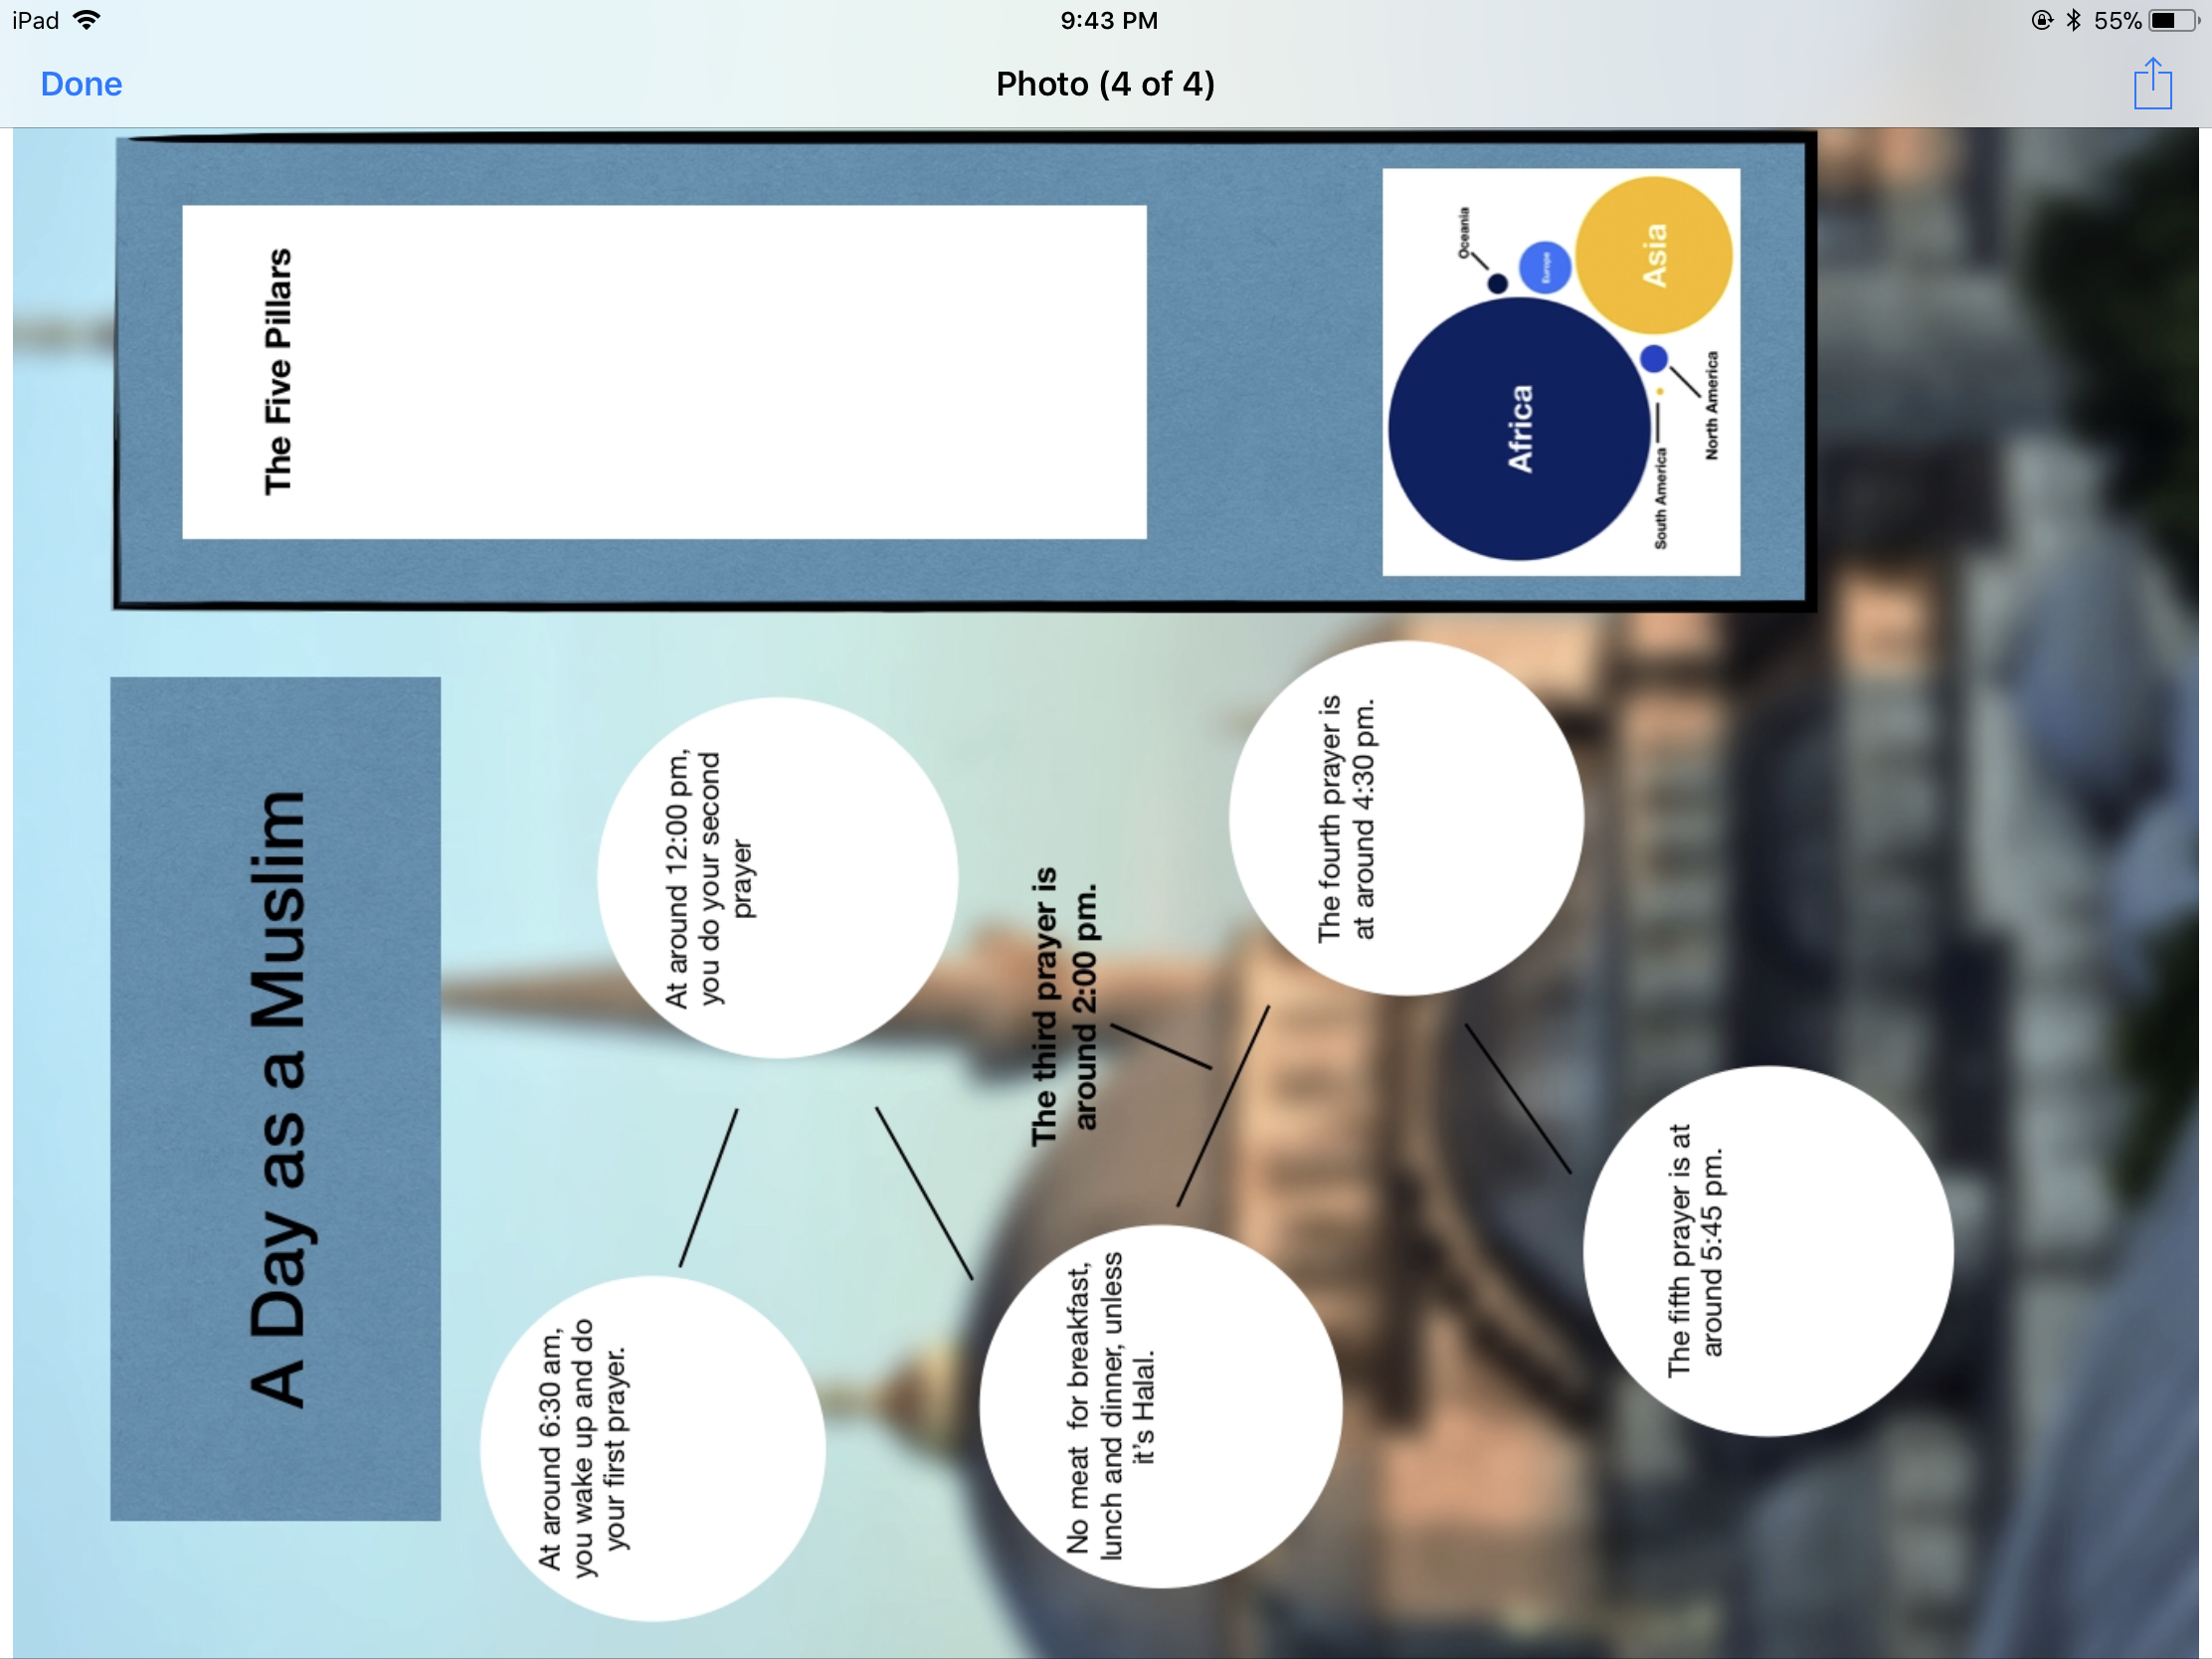
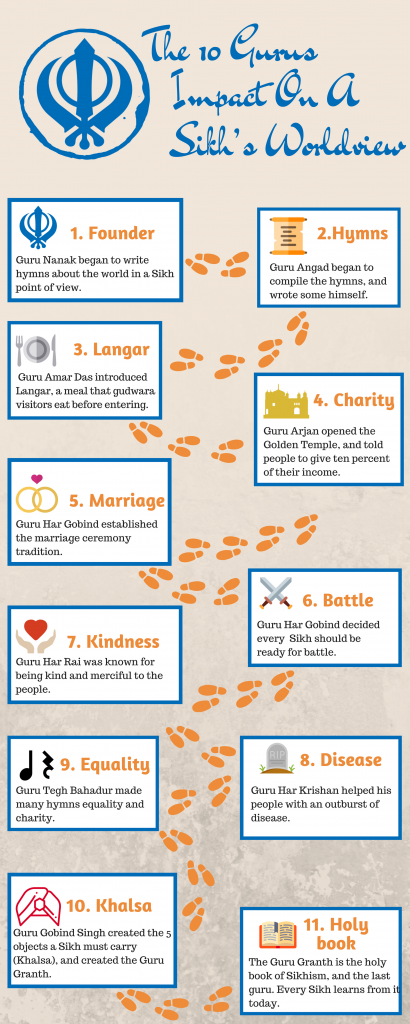
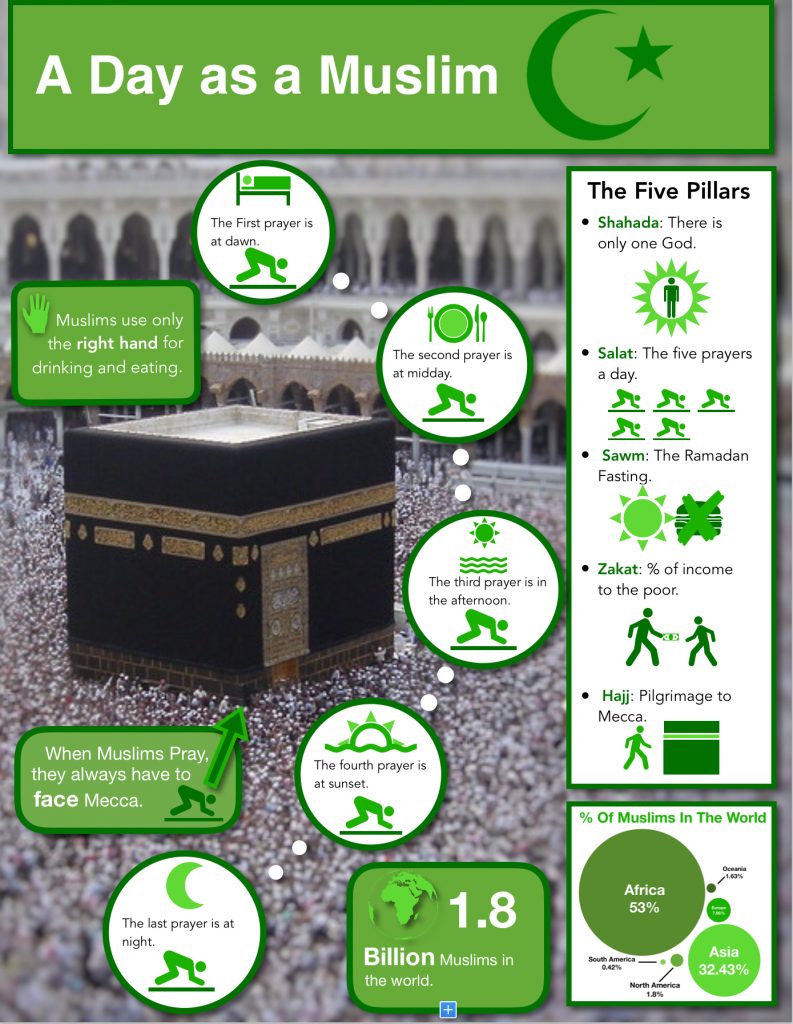
My favourite thing we’ve done all year is the religion unit because religion has always been one of those things that where your curious about it but you don’t know where to start because their are some many differ religions. Another reason I loved that unit is because we got really good critique from my classmates, Ms. Willemese, and some advice from Mr. Hughes.
-

- This was our first draft. The critique we got was to add icons and change the background picture.
-

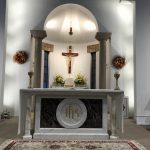
- Our second draft was better but was still a far ways from being done. Some great advice we got was change the crescent to green and add more content. Although by then we had already made all the decisions we just ran out of time to do them all.
To read the entire worldview and religion post click here.
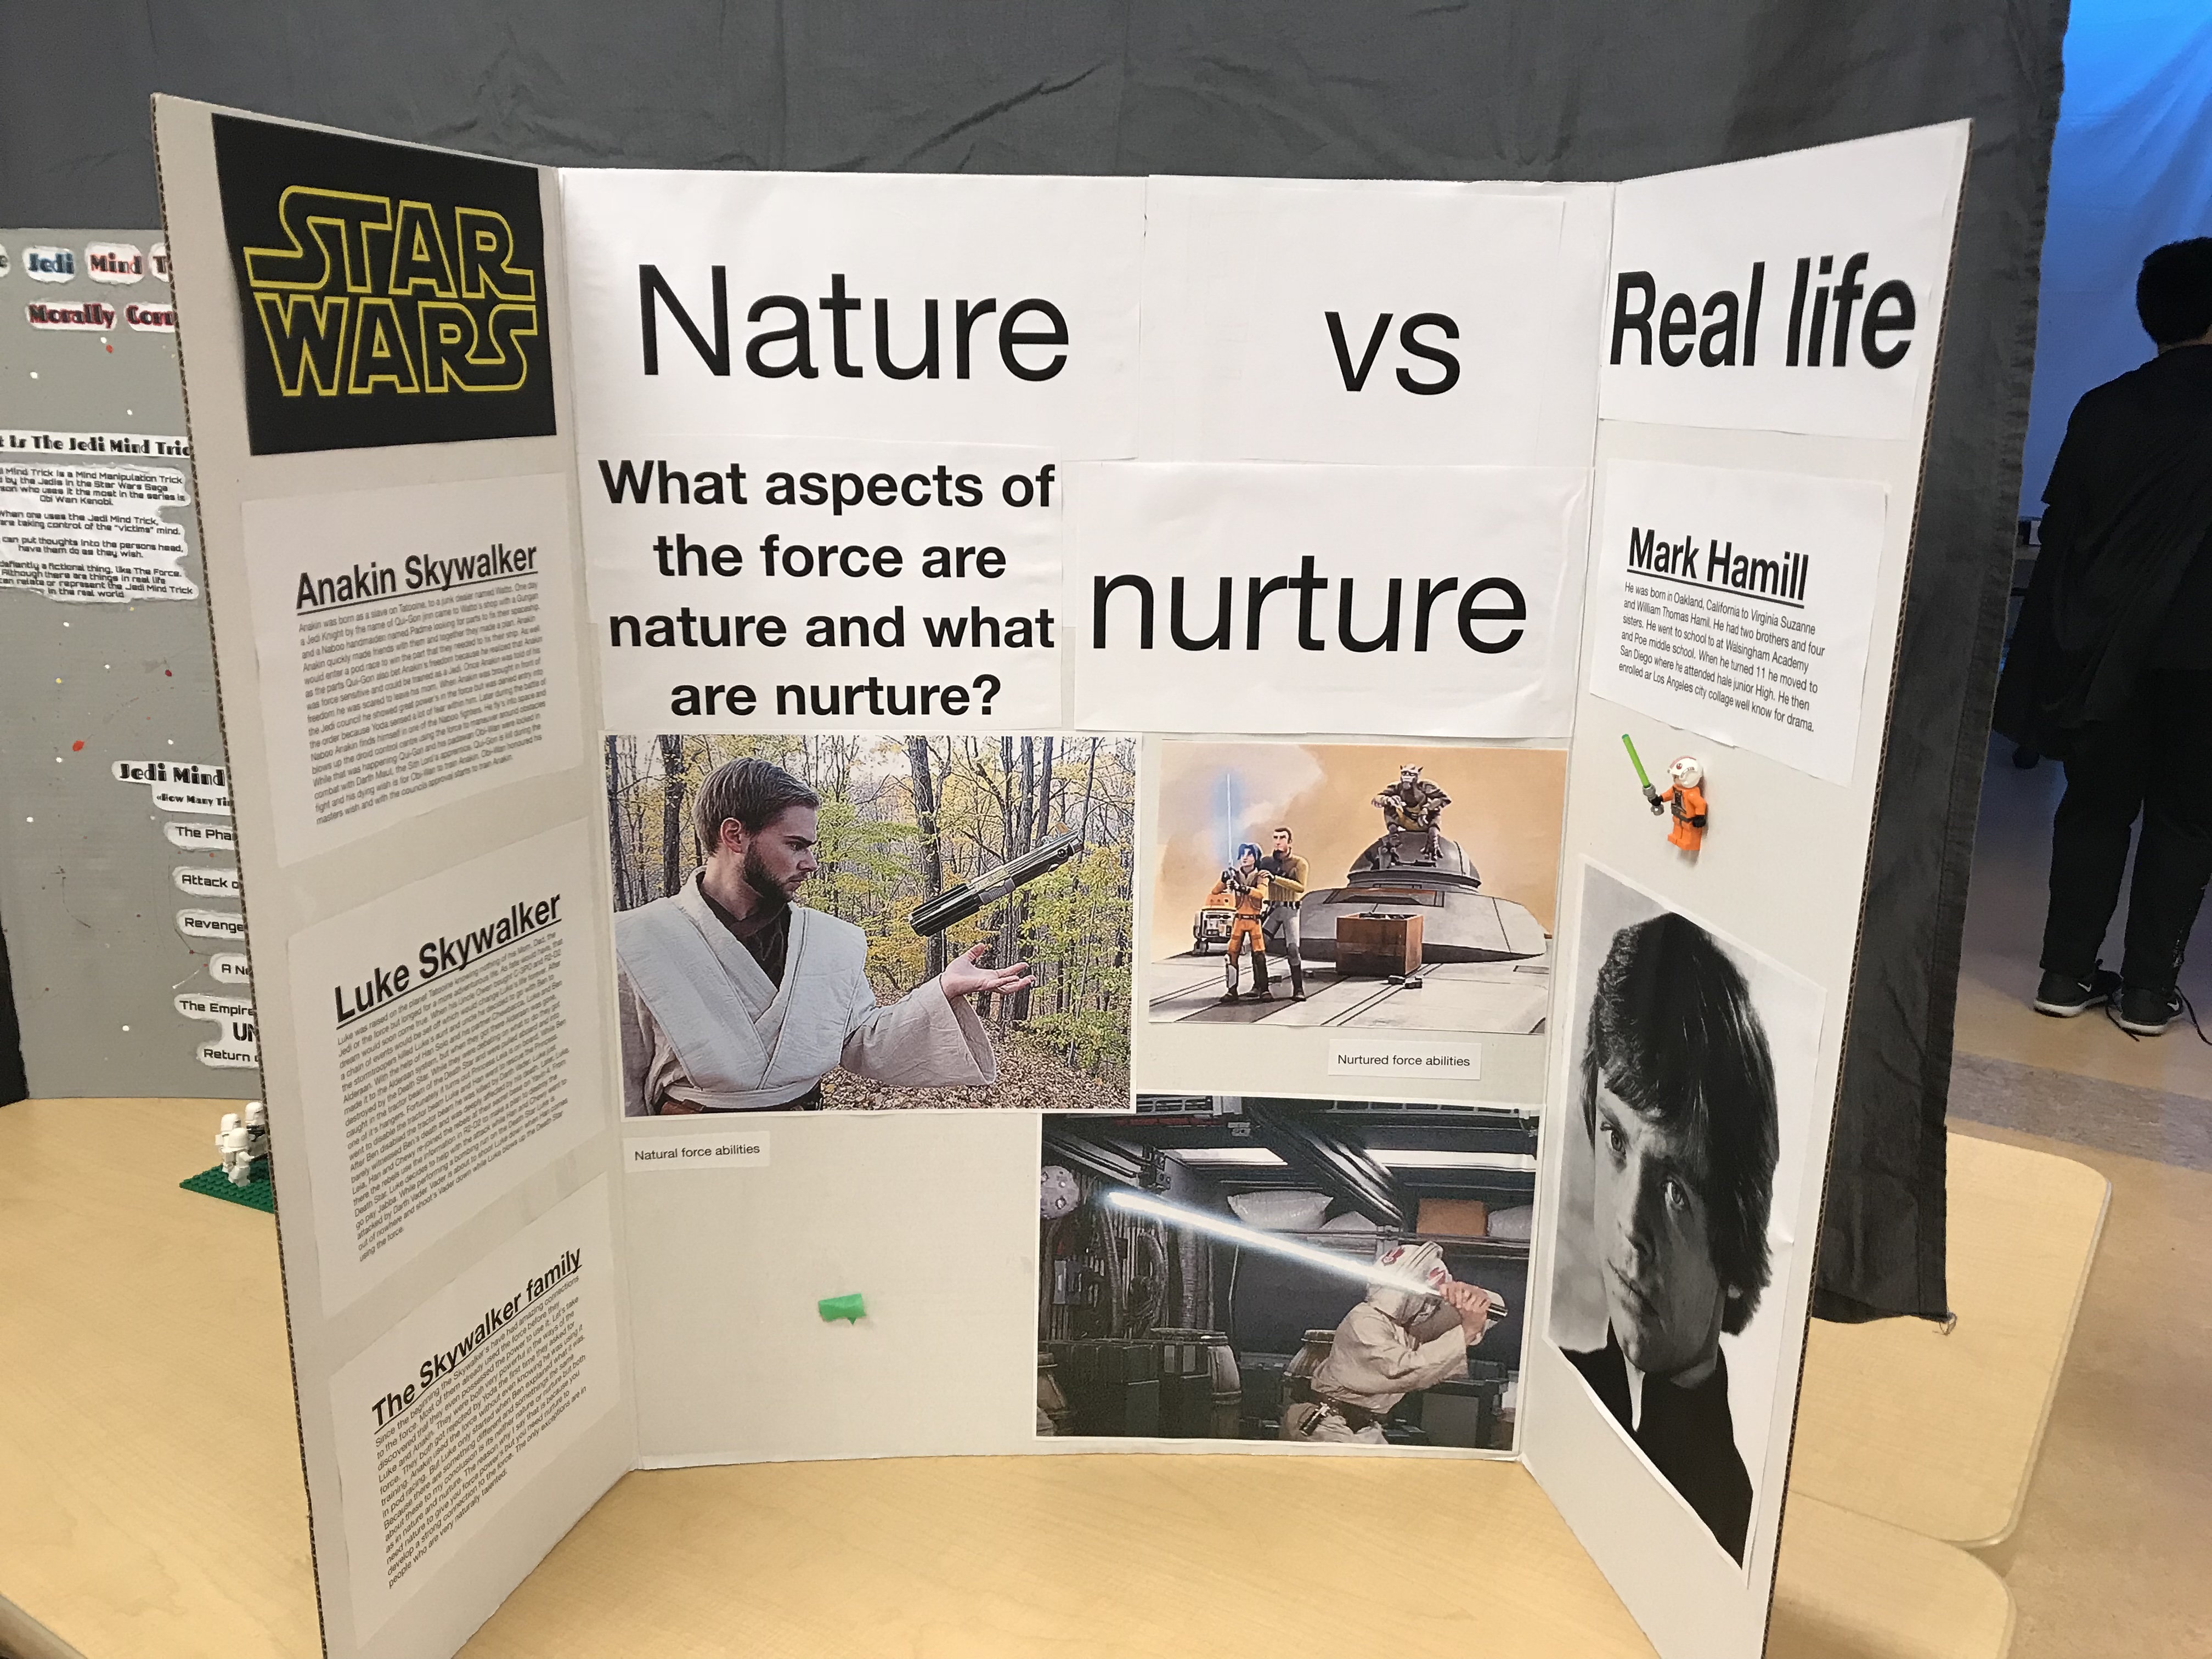
Another one of the things I’m proud of is the Star Wars exhibition. Although it was a lot more in-depth than any of the other projects that we have done so far I really liked it after it was over, because while it was going on I was stressed like crazy. But I was ready for the day of the presentation and one of the biggest things I learned is that procrastination is not good at all.
The frustrating work
There was only a couple of the big things that got me frustrated so far this year. One was the advertising unit because I kept rushing through each draft and ended up having to do 18 different drafts. Now because of that learning experience I learned that speed isn’t always the best, and that I should slow down when doing assignments because I might miss something or come up with an even better idea.
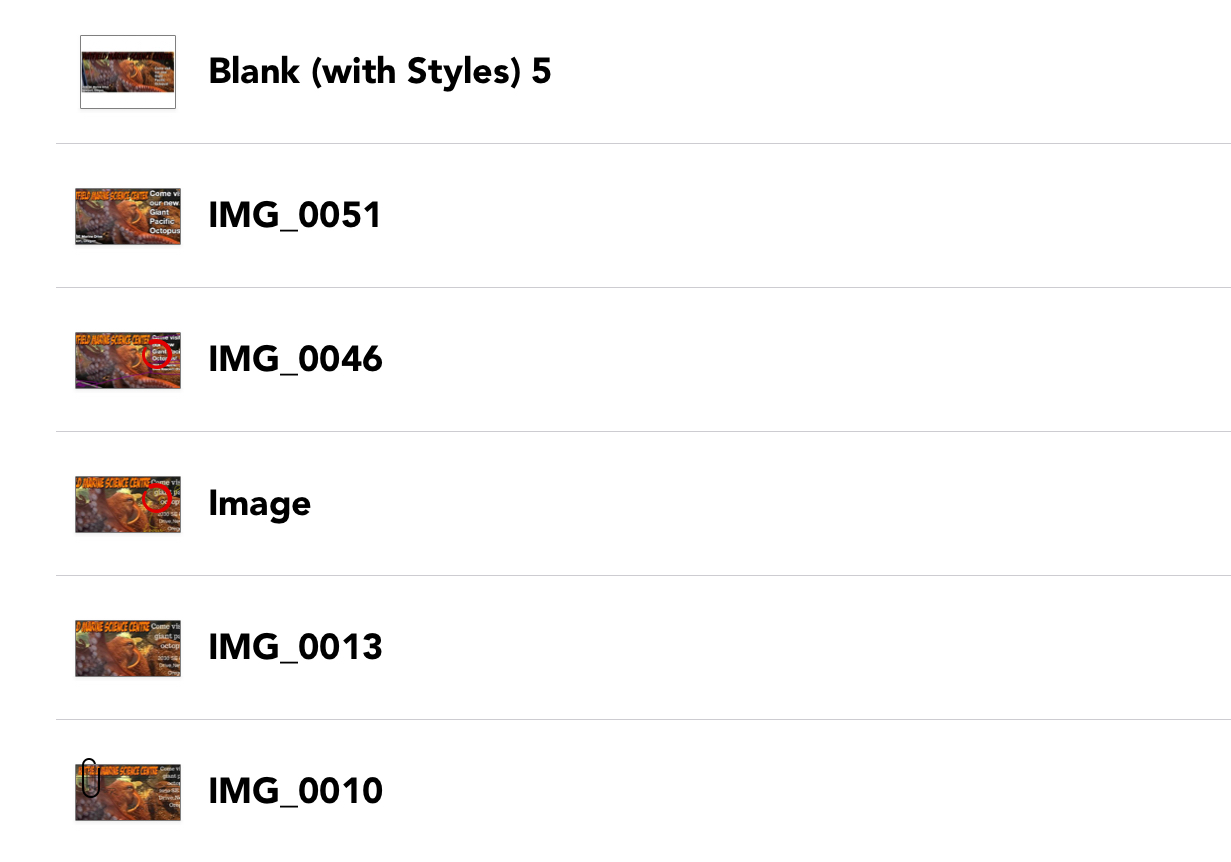
Some of the ad drafts that I did.
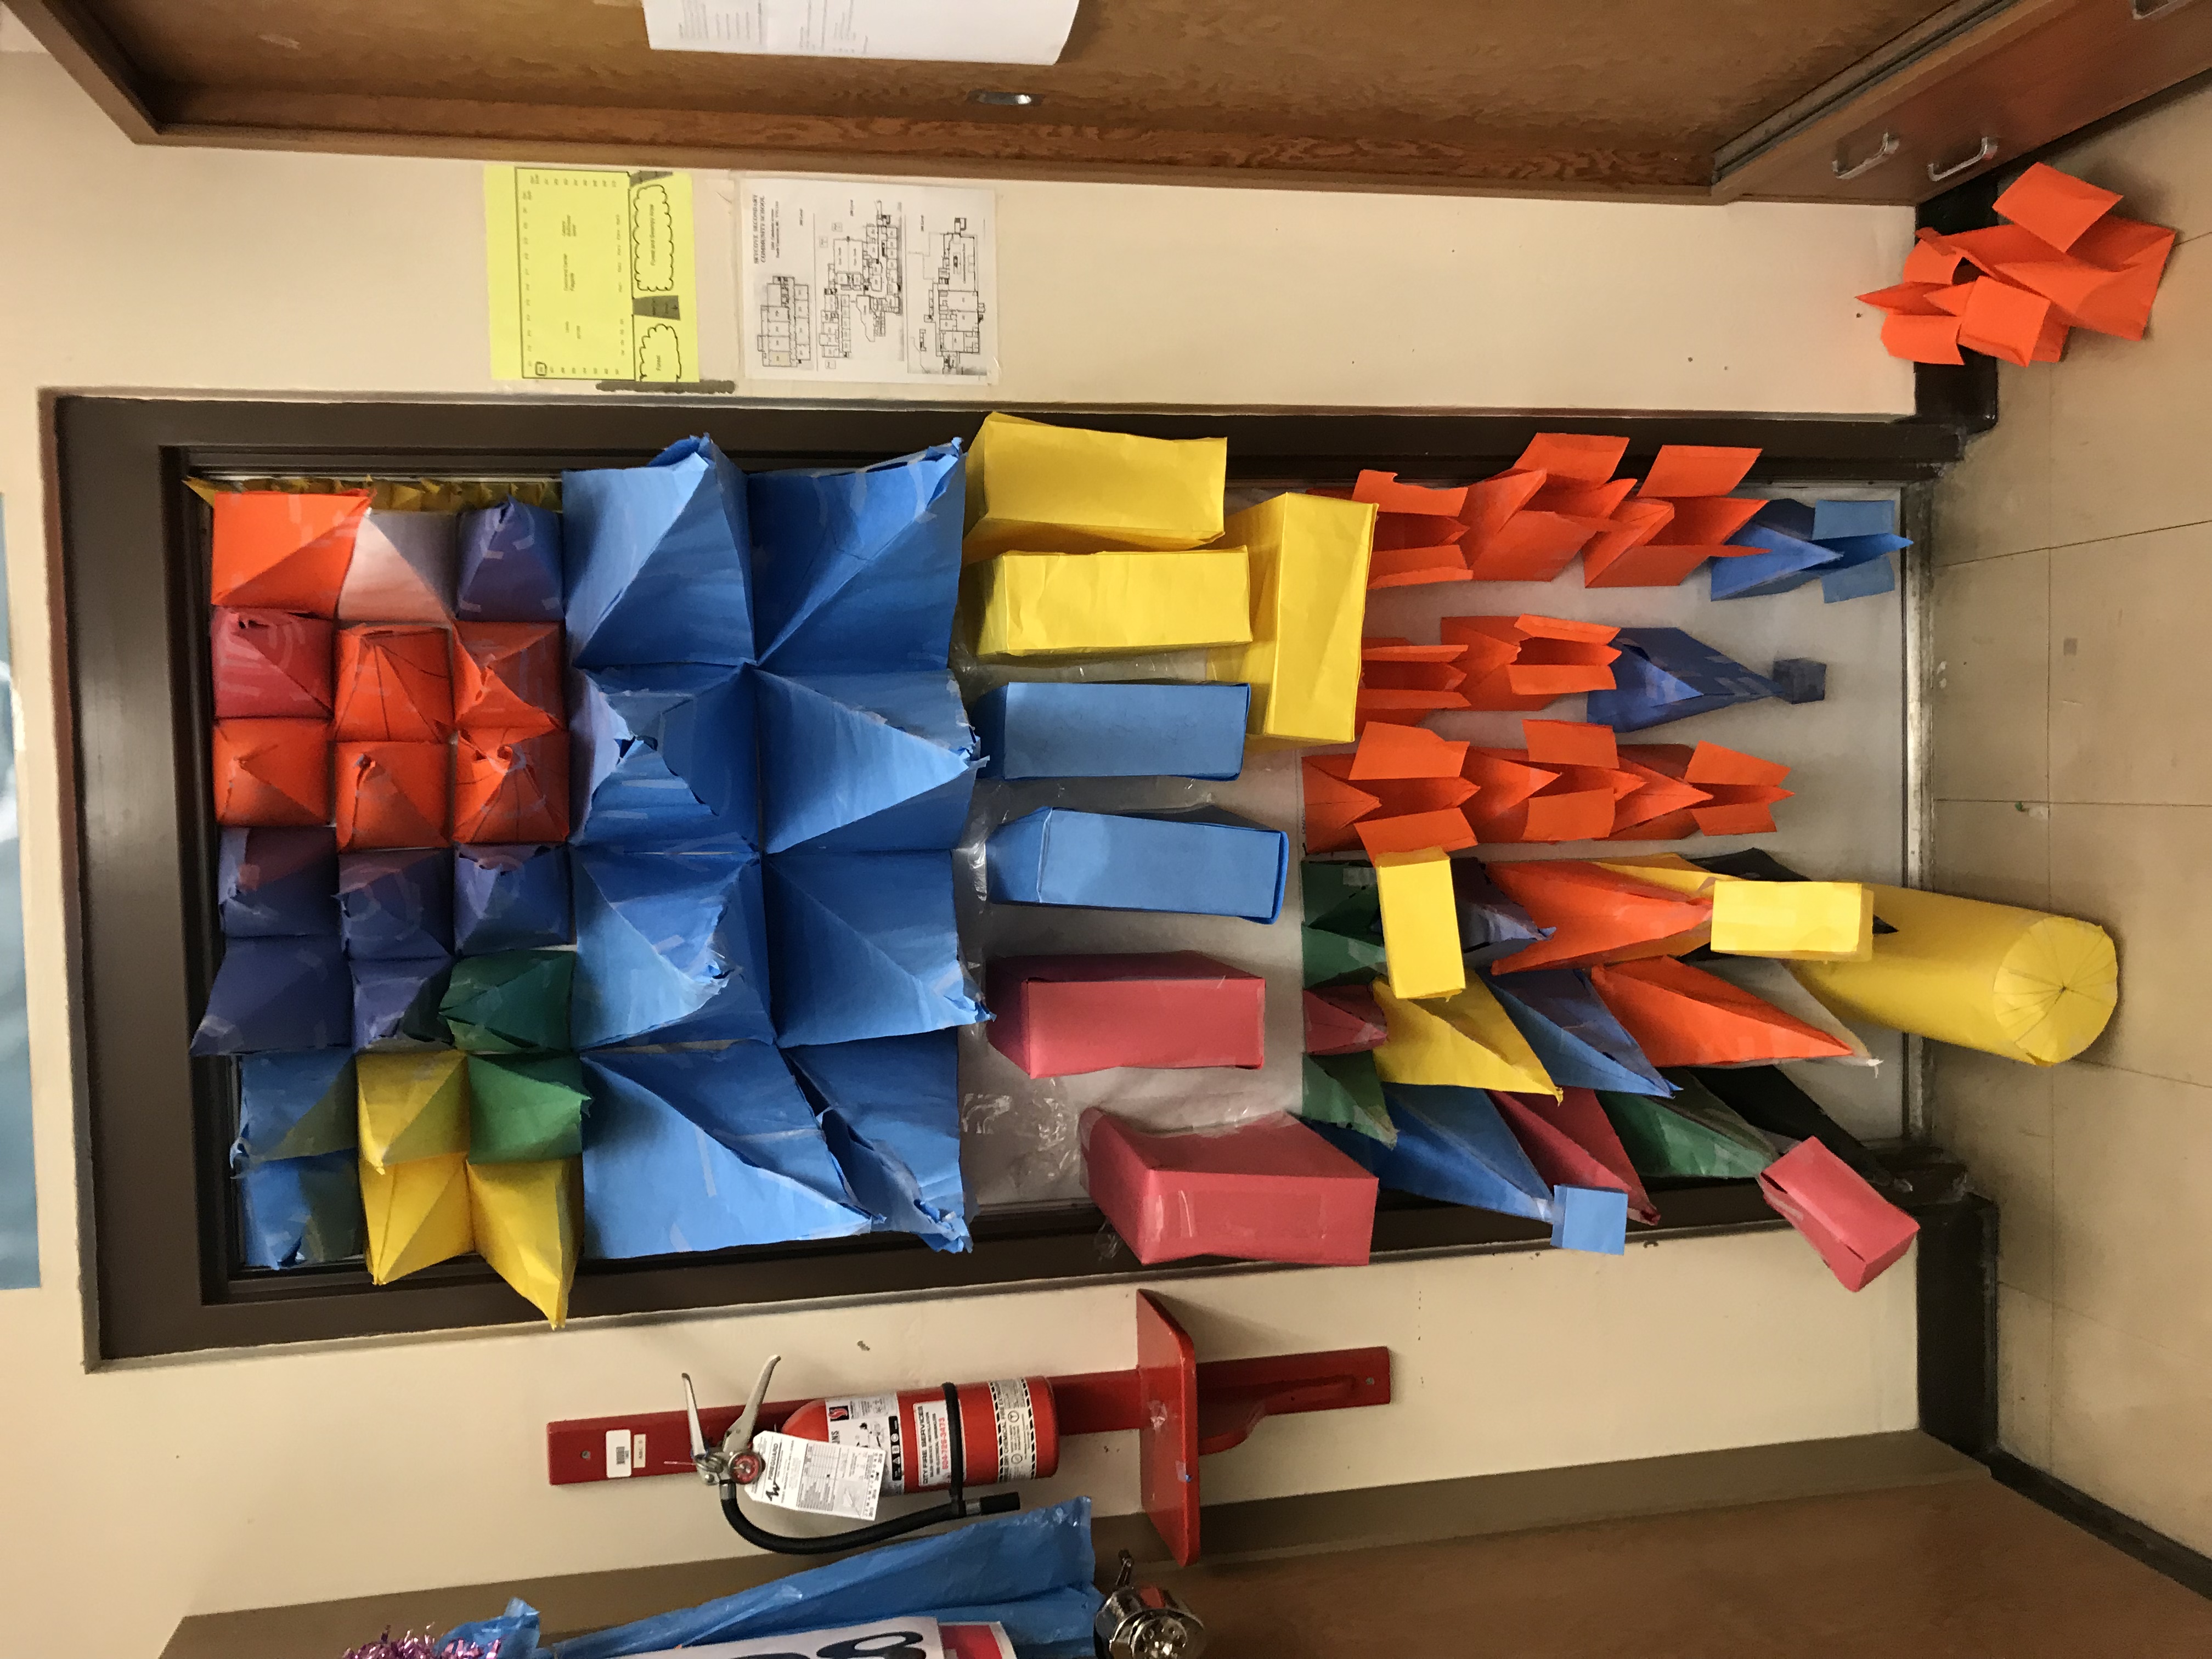
The other was the door is a bore project in math. It was really fun but really frustrating because we didn’t check each other’s calculations so we end up almost having to restart after 2 weeks of hard work. But we used our problem solving skills as well as some help from Ms. Klausen to figure out a solution. To read the full story click here.
The bad stuff
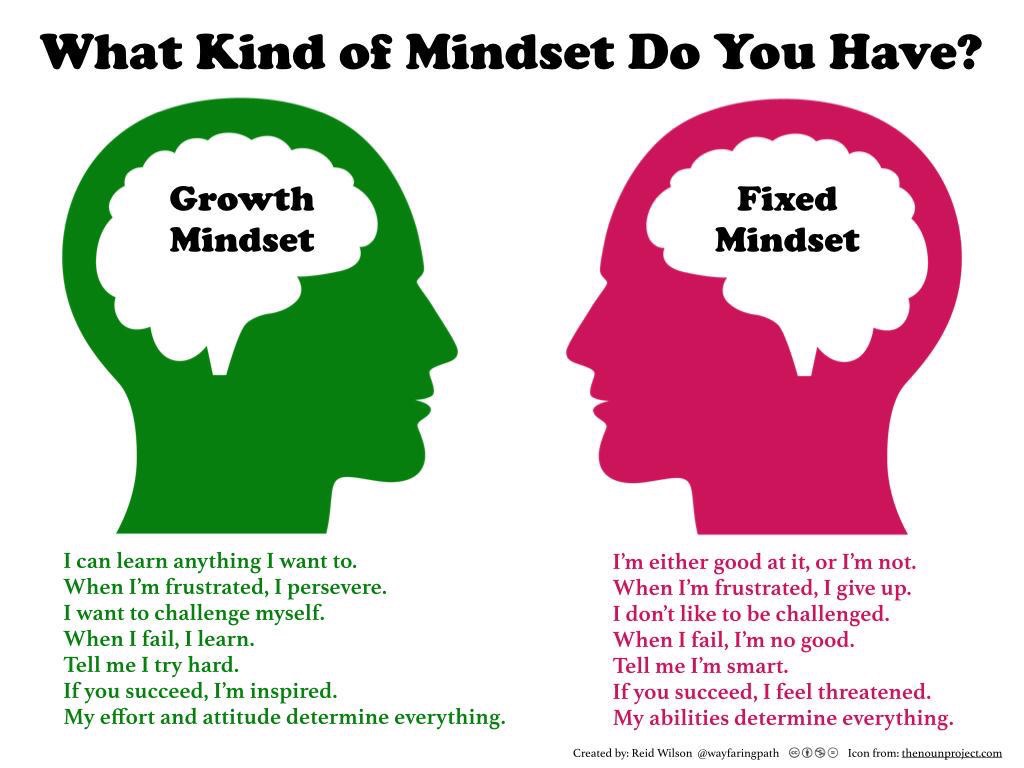
The worst piece of work that I have done this year was probably the growth mindset unit in maker. The reason I think this is because I procrastinated a lot of the work in that unit, mostly because it was the start of the year and because I over estimated my abilities.
Myself as a learner
Now reflecting back on the year so far and the rest of the year to come I have a bunch of things that I’m going to change and somethings that I’m going to keep. A couple of things that are going to change are I’m not going to procrastinate every thing I’m going to get everything I need to get done done before it gets to late. Another thing I’m going to change is I’m not going to over estimate my abilities. Some things that I am not changing are reading, staying in PLP.
Thats all for this post till next bye😀😀