This is my correlation vs causation project. We had to start this for our scimatics class (Science and Math). For this post I will talk about three core competencies, my mind map and my presentation and findings.
This is my MindMap that I ended up doing after the project was finished (Whoops). This MindMap is about what is correlation and causation and what it affects
CORE COMPETENCIES:
#1 Representing:
This core competency is about using mathematical ideas and symbols in your graph. This is something I did try and use while I was presenting my graph and survey. I remember using words like Bias, and population when I was writing about my survey. This is not something that I would have done in the past and I should. I say that because it is way easier for me to convey a idea when I use them and it has the ability to shorten your sentences that would be really long because your trying to convey a long point. I also had just learned them and wanted to sound really smart. 😁
#2 Communicating:
This is also something that I don’t do often enough. This competency is sort of the same idea as #1 but it is about representing it verbally. So instead of writing and showing, your talking instead. I never tend to speak as much, compared to how much I show. This project was different. I tied them both in an equal amount and I didn’t write as much and tried to speak more. I think I did pretty well on that front.
#3 Finally Applying and Innovating:
This competency is about ethics and community. For instance, it is very unethical to force someone to do your survey compared to just asking them. All of the people who did my survey where politely asked or they themselves choose to do it. I did only get 15 answers but the people I asked where a group of 29. I do believe that I followed goo ethics in my survey and I always have. I don’t think I have a lot to improve on in this category.
FINAL:
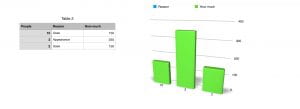
If you were wondering how my survey turned out, here are the charts and results:
My two topics where shoe preferences (Looks, Colour, Use, Brand), and average amount spent on shoes.


Leave a Reply