During term 1 in PLP 9 the one of the main focuses in my Scimatics class was; How are correlation and causation different? There were multiple small projects that eventually led up to a final project, a presentation of our correlation findings.
Big Idea: Analyzing the validity, reliability, and representation of data enables us to compare and interpret. An example of how I used the this curricular competency is in analyzing the raw survey results we received and processing and inserting them into a proper spreadsheet.
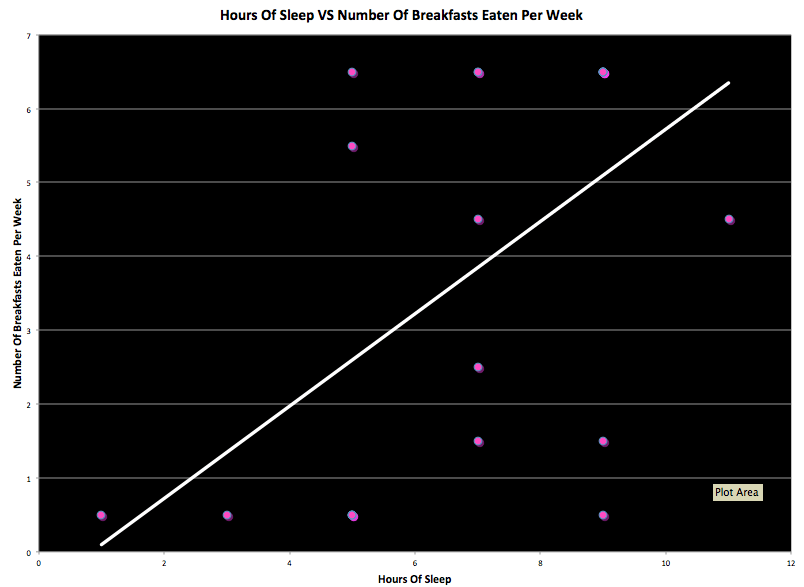
Communicating and Representing: Represent mathematical ideas in concrete, pictorial, and symbolic forms. A good example of how I used the this curricular competency is the graphs I created with our survey results.
Communicating and Representing: Use mathematical vocabulary and language to contribute to mathematical discussions. Personally I think I could’ve used this competency in my project to a greater extent to help show my understanding of the difference in correlation and causation.
Applying and Innovating: Contribute to care for self, others, community, and world through individual or collaborative approaches. I believe that I used this competency well as I believe I worked well with my partner, Alex.
-Finn