In science class, we have been studying the Periodic Table and it’s different trends, patterns and sometimes even codes. Then we were told that we had to make our very own Periodic Table of something… well… ANYTHING! So I chose to focus mine on different breeds of dogs! I chose dogs because I love animals and I was interested to learn all this cool information on the animal that I love the most.
The Periodic Table of Dogs is my interpretation of The Periodic Table of Elements. For this project I created a series of trends and patterns and put them together in a table, of sorts. This blog post is about how to decode the trends and patterns within my Periodic Table of Dogs.
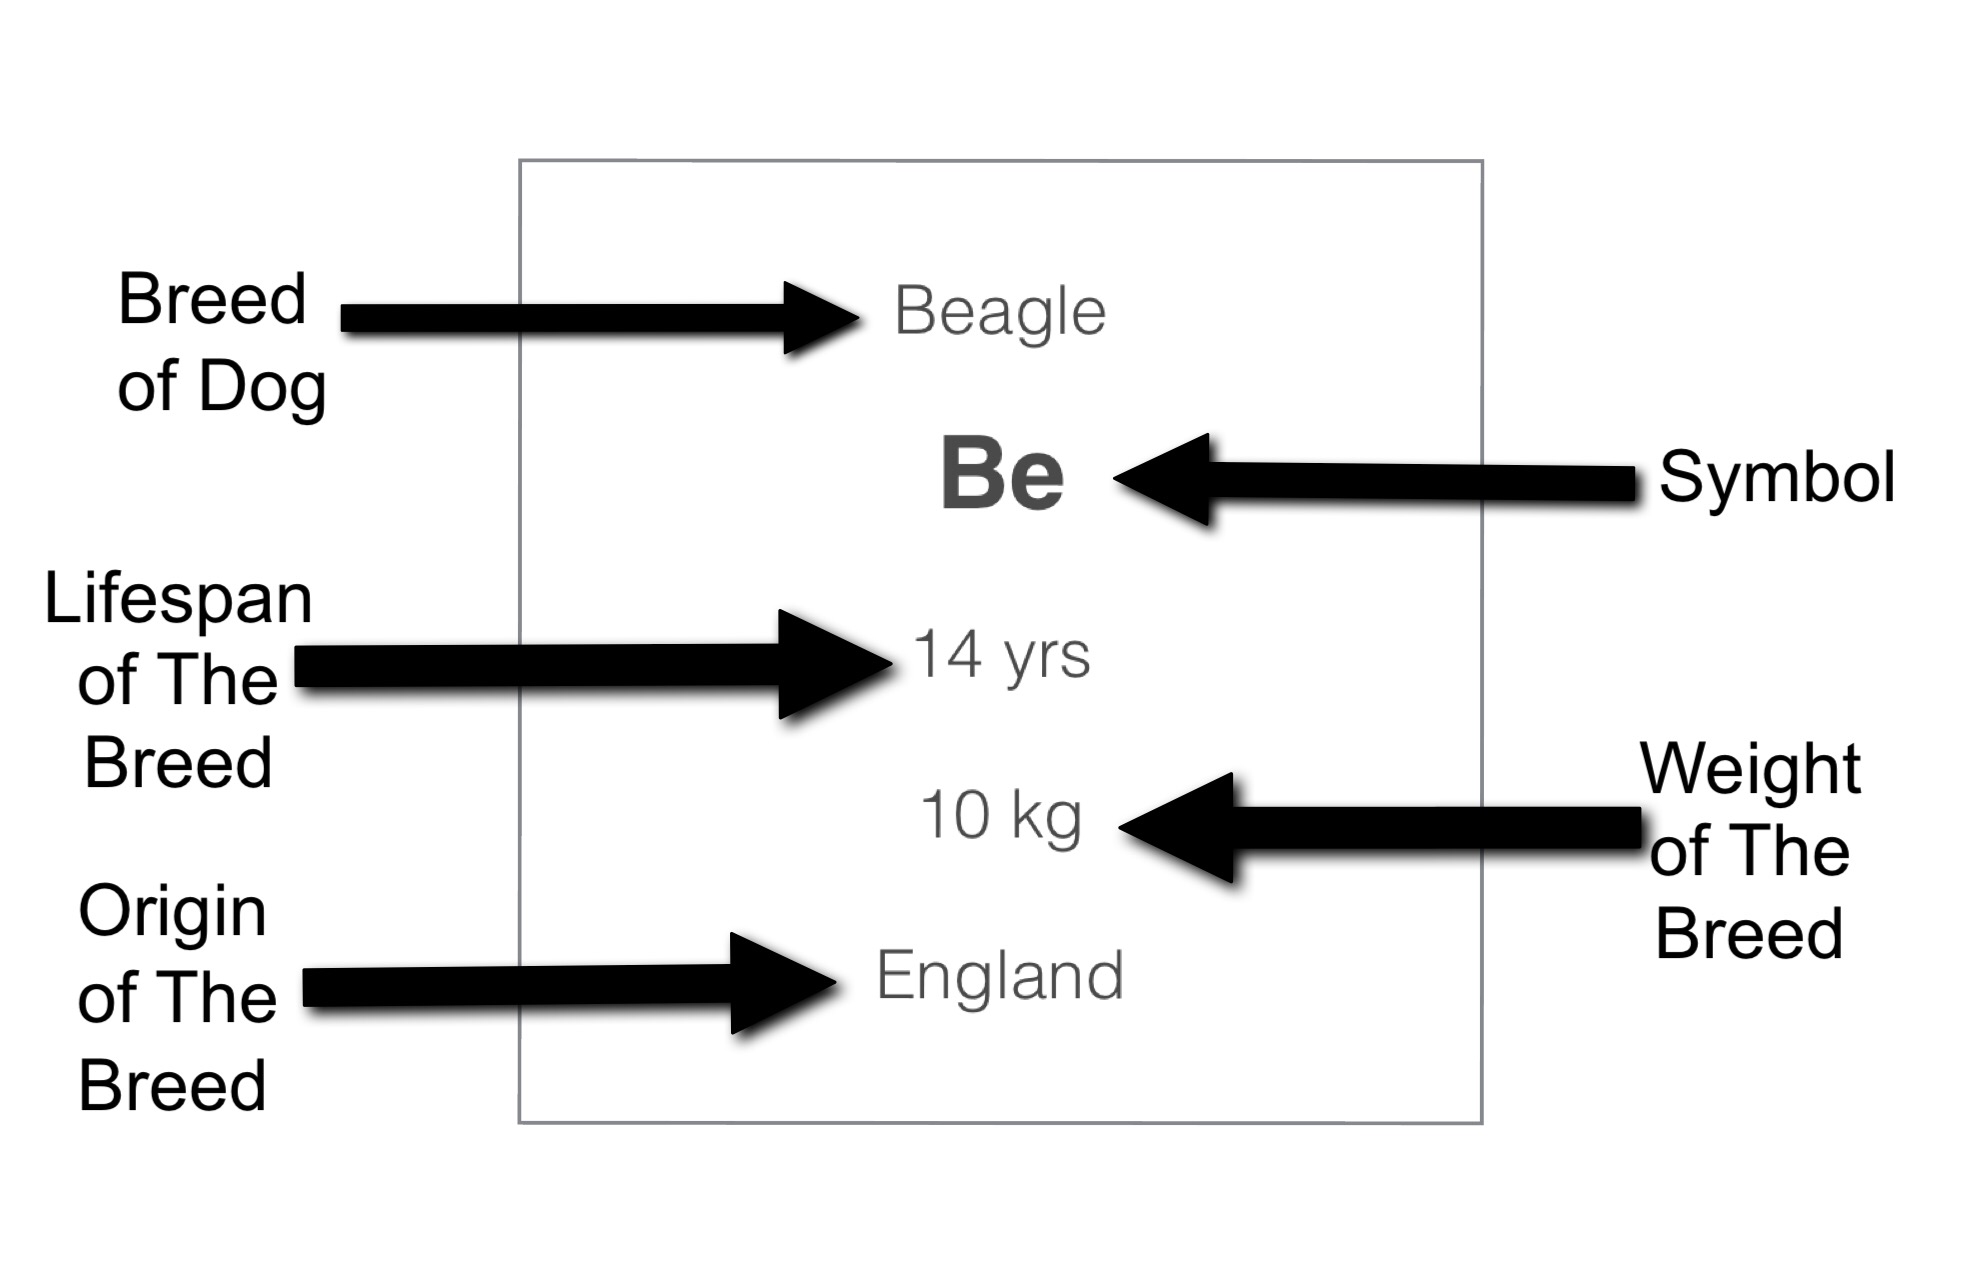
First off this is the example for each separate tile that I have on my project, it probably explains itself better than I could:
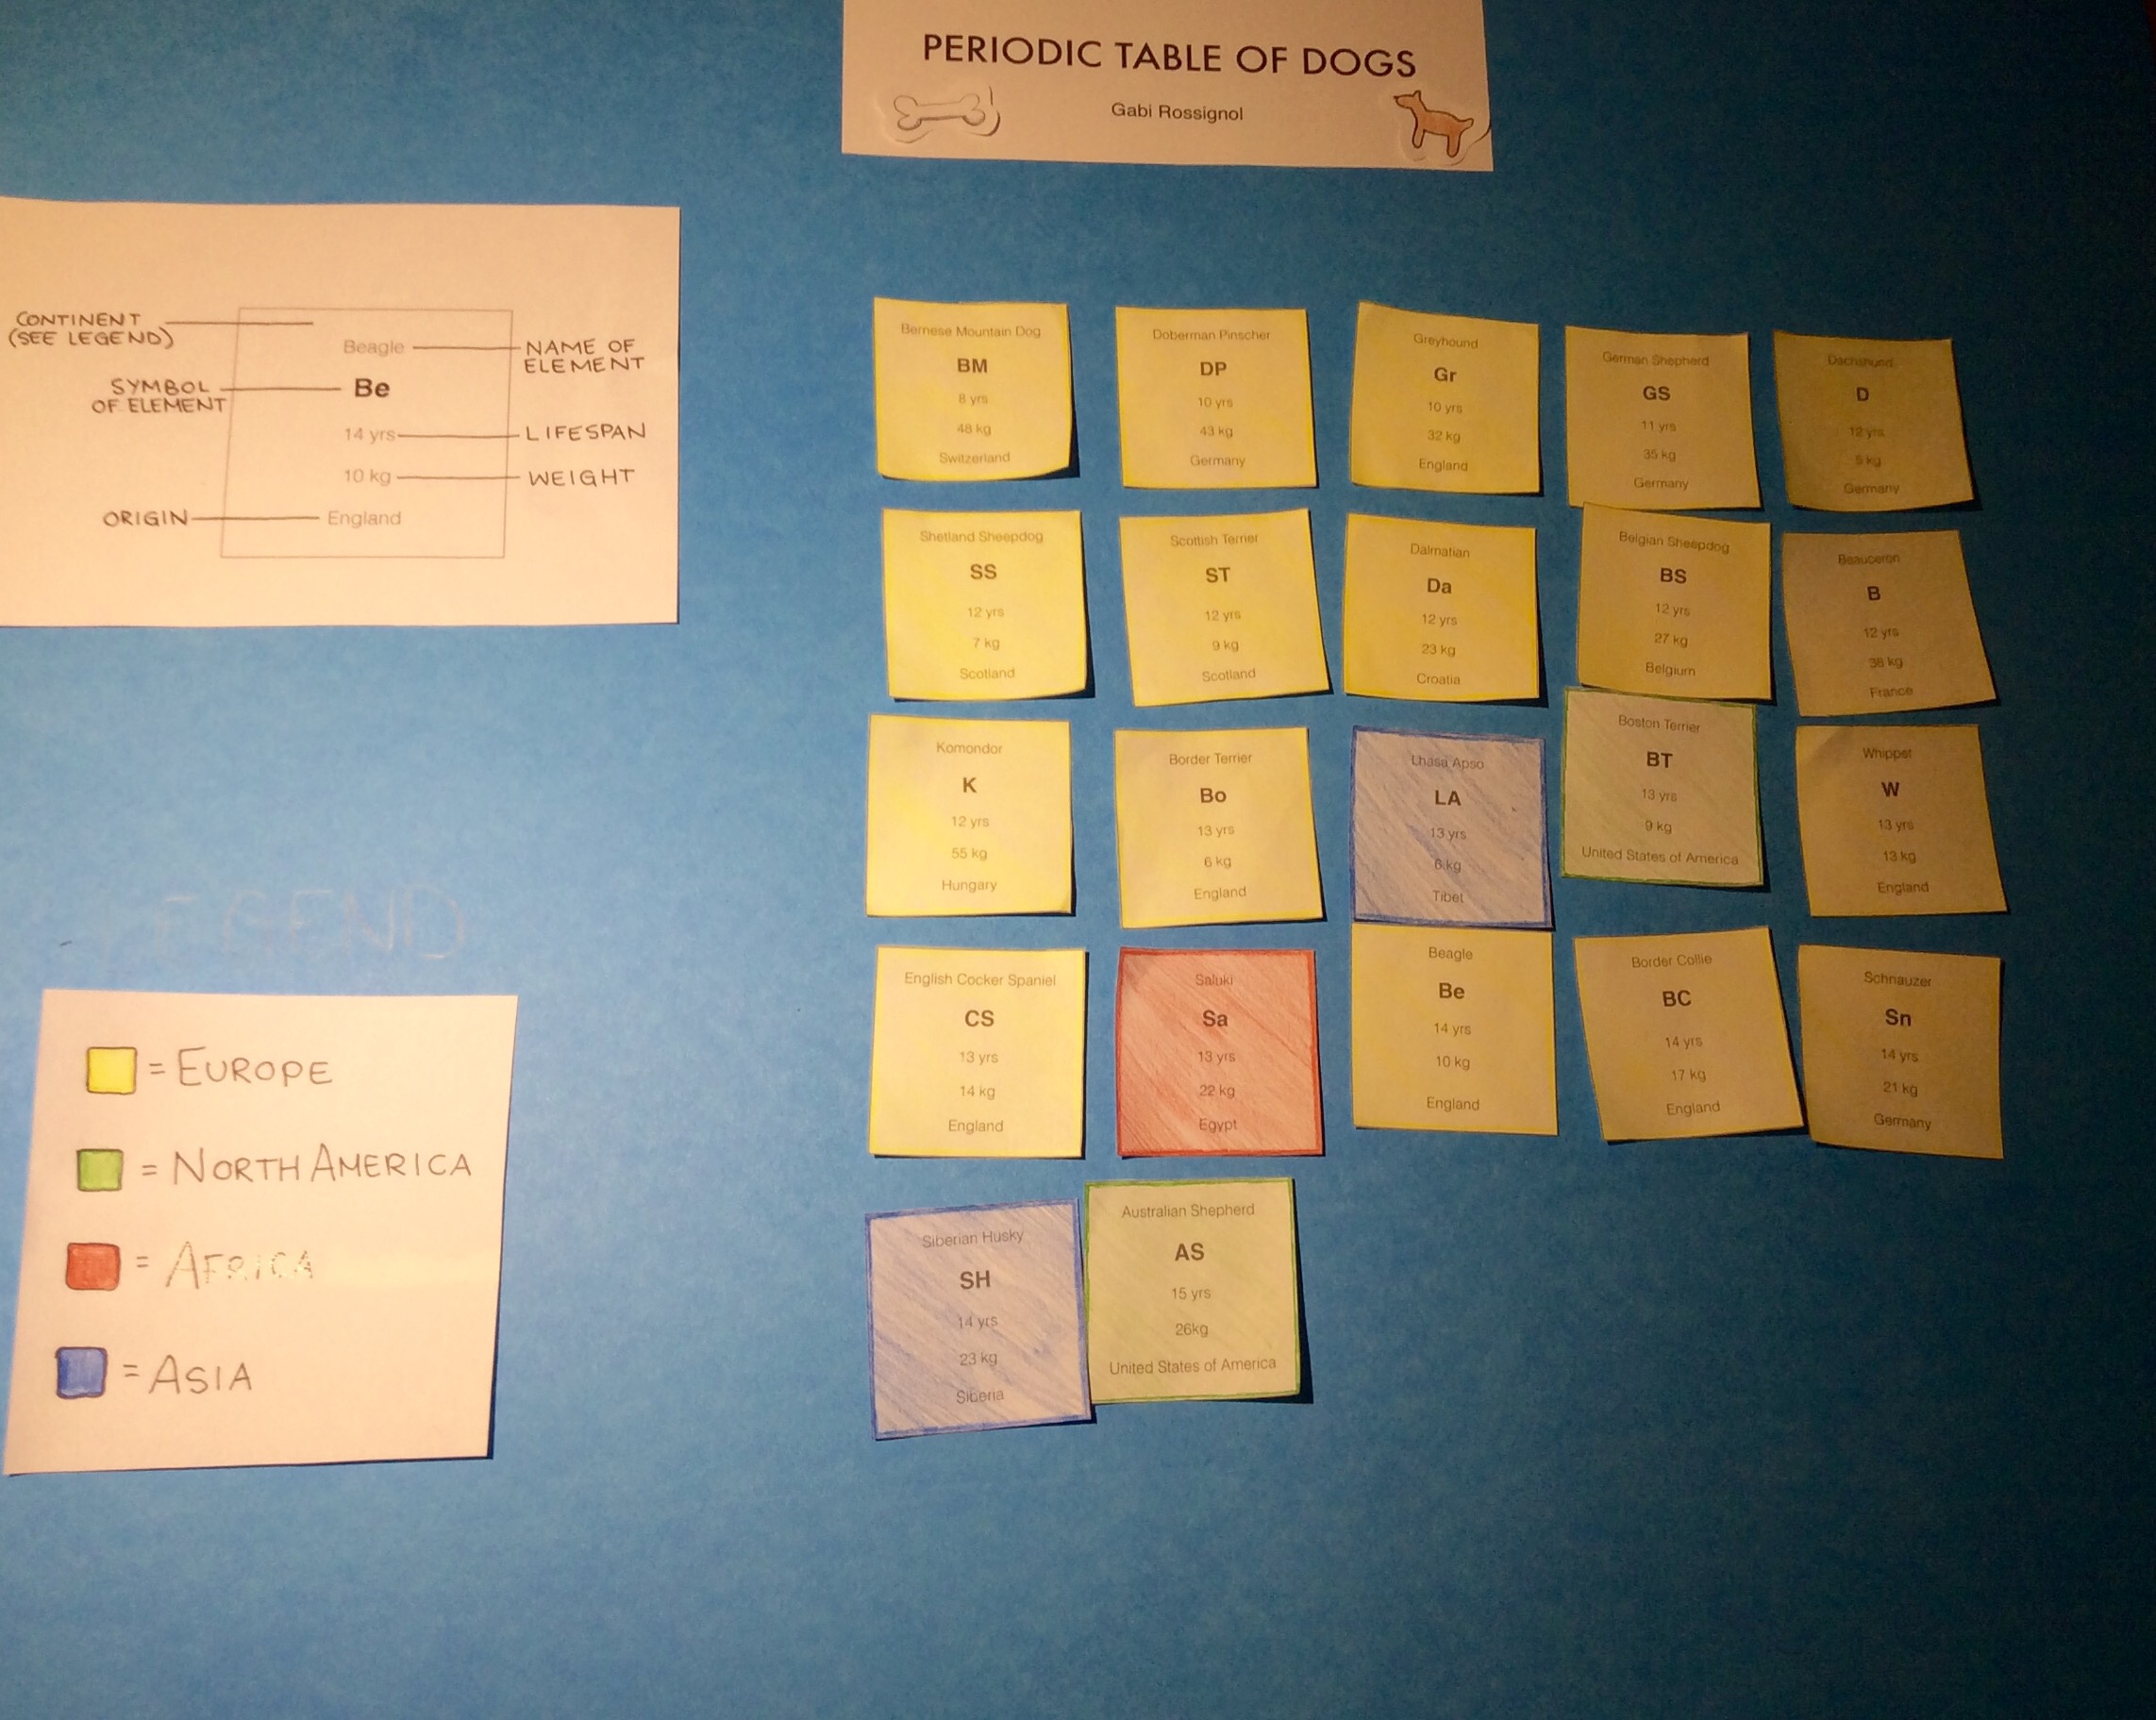
The first trend I have in my table is that I colour coded the breeds of dogs to show what continent they come from. The majority where from Europe, two from North America, one from Africa, and one from Asia.
Then I sorted the age spans from youngest to oldest. Being youngest at the top left of the table and oldest at the bottom right. Inside of this trend, I also put them from lightest weight to heaviest weight for each age group.
And that’s pretty much it, not to hard to understand, right?