How Are They Different?
This unit has been a very interesting unit for me as someone that is still learning these core math skills. I had never learned about this theory of correlation and causation, and I decently didn’t know all of the underlining concepts and rules. One guideline that I learned by the end of the unit was that if two variable show a causation it is a also correlation, but if two Variables show a correlation, most of the time it isn’t a causation. We stated this project in the usual PLP way by asking tons of question on of the way us we started asking the question was with a little pregame research. Me and my partner Marshall decided on two new questions to focus our research upon.
  The questions were “Does average temperature in Vancouver have a correlation with your health ?”And “Does your mood cause you to pick different clothes?” These questions had many problems, that we didn’t realize at the time, but were so big we eventually had to change the questions so that they could be easily researched. Our final questions were based apron research we had found and calculated so they were structured differently. The two new correlating variables are people who drowned after falling out of a fishing boat VS the marriage rate in Kentucky. These two variables have a plausible explanation I for why they are an correlation without a causation.

The other two variables we use for proving a causation are the US years of education VS US income rates. We were able to prove this was a causation by not only showing plausibility but also showing signs of Analogy. You can tell if a relation ship is a causation using Analogy, when a relationship is more likely to be causal, because there are proven relationships between similar causes and effects.
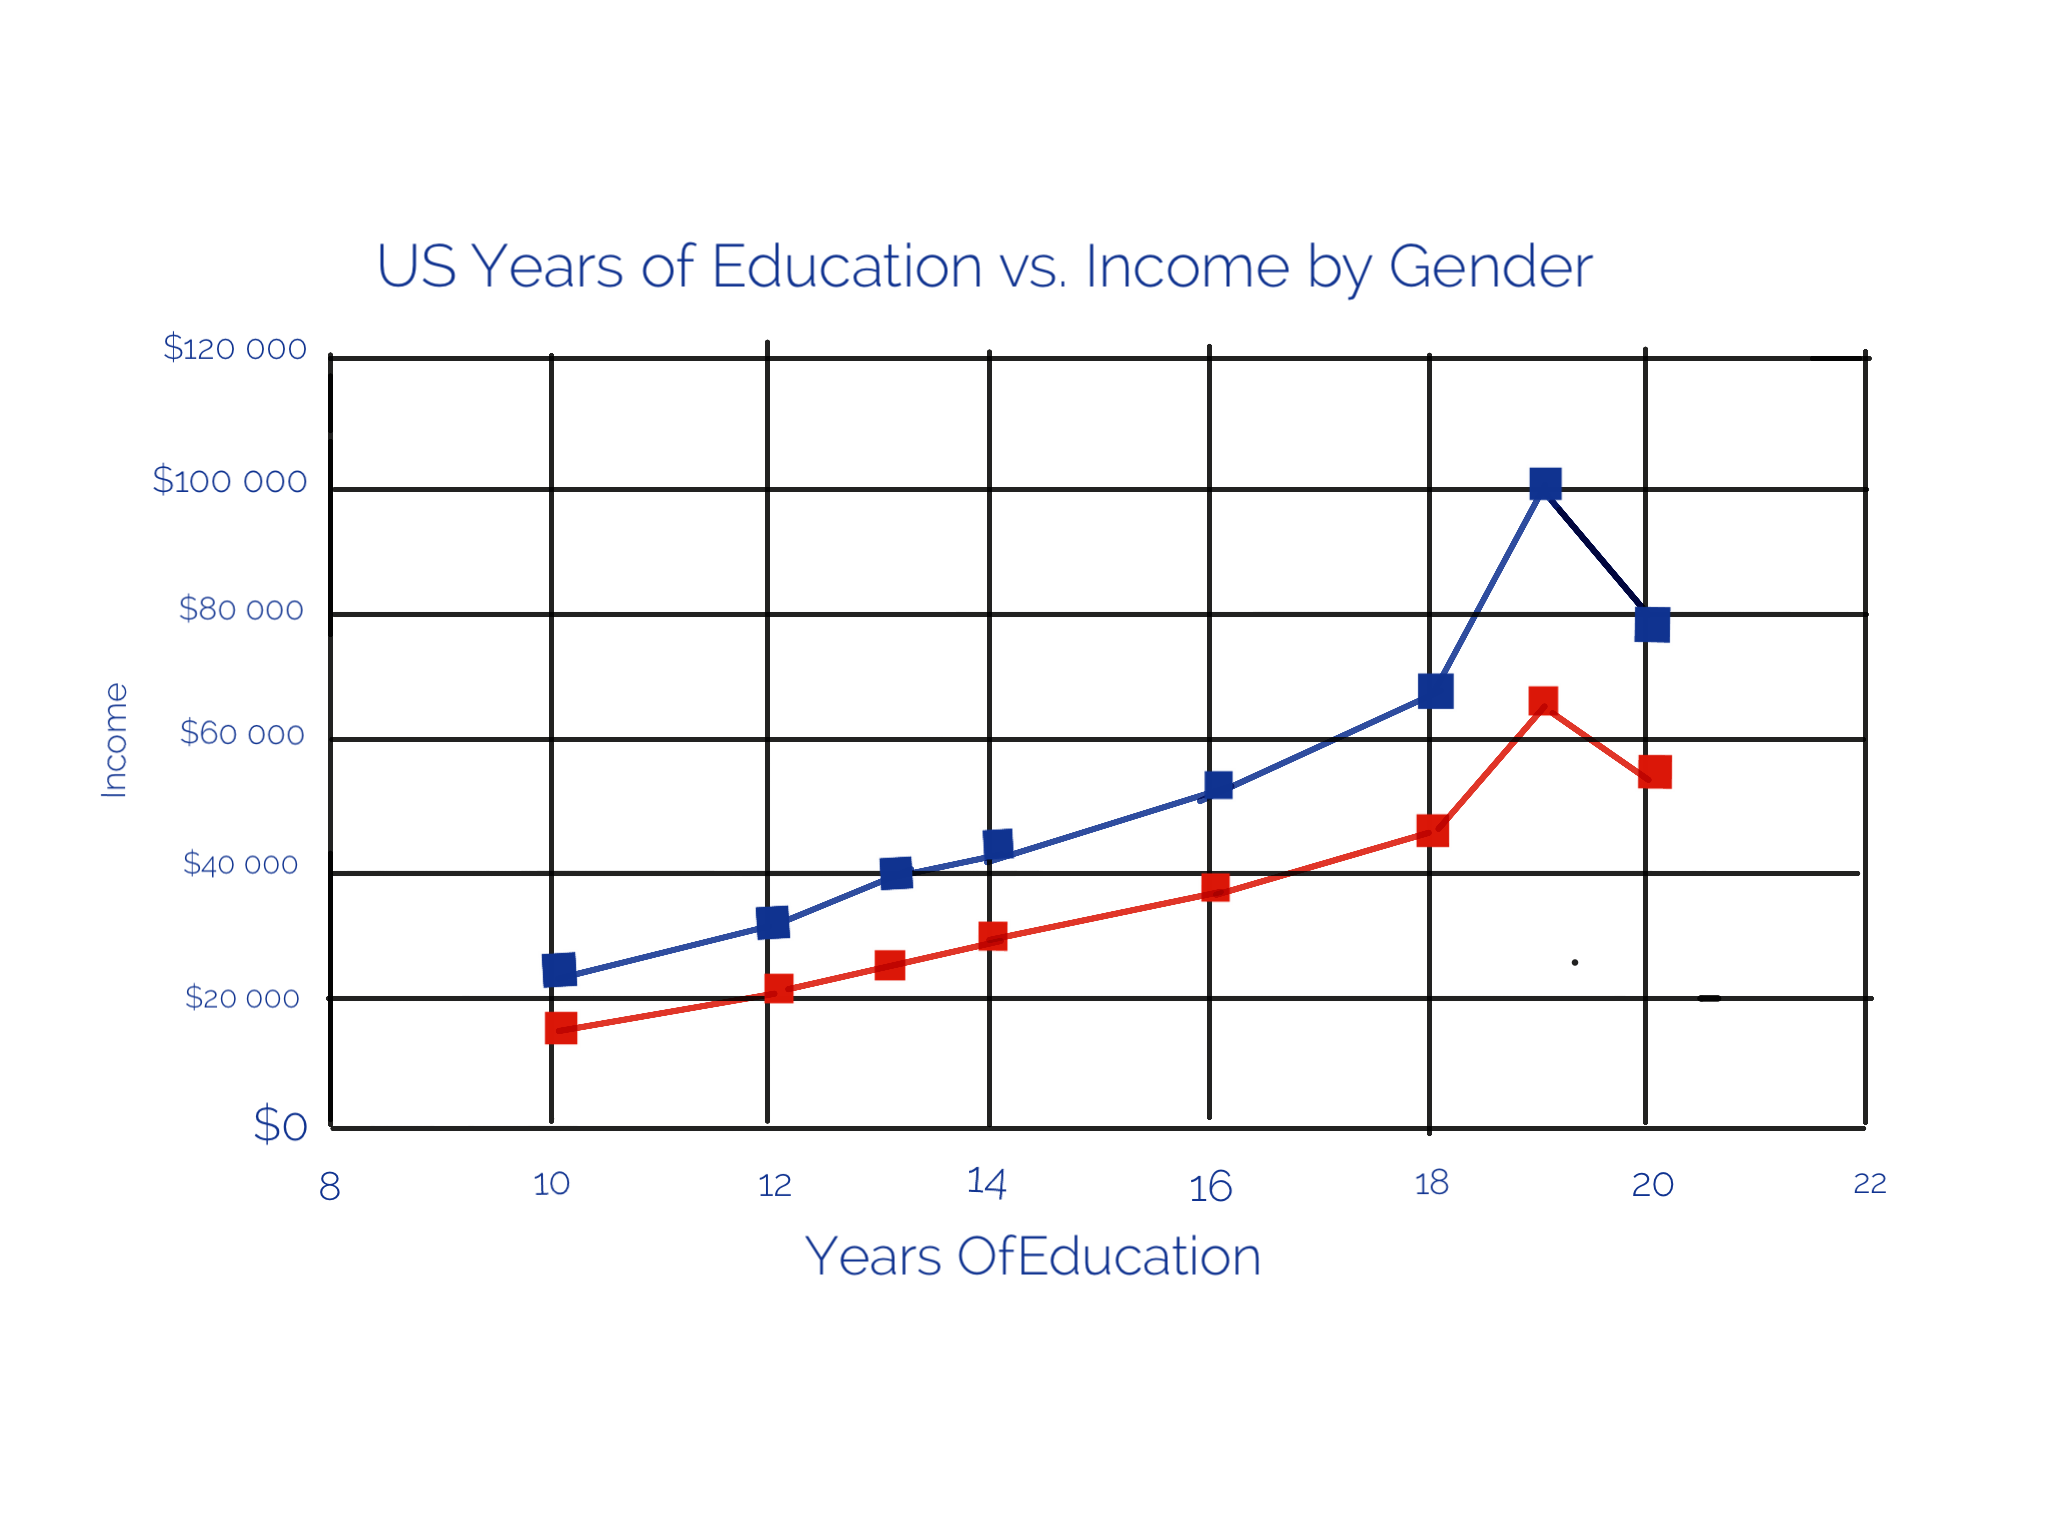
There was a very cool website that I use to understand Causation a little bit more called Stats With Cats, be sure to check it out. Before our final keynote presentation we needed to graph the research that we used for our causation example. We made this graph in Sketches/Ruler Edition because of the simplistically of its format. Our final step was finishing the keynote and presenting it to the audience of our peers. This step went really well because my partner and I made sure to meet over the weekend to practice.