Welcome to the last project of quarter 3. This project was called “The More Things Change” and was all about European Settlement, and the Fur Trade. As always, the project had a driving question, this one being “What did European Settlement mean for all the people involved” To answer this question, we did a lot of learning, and created an infographic and video to show off all our work.
And our accompanying explanation video!
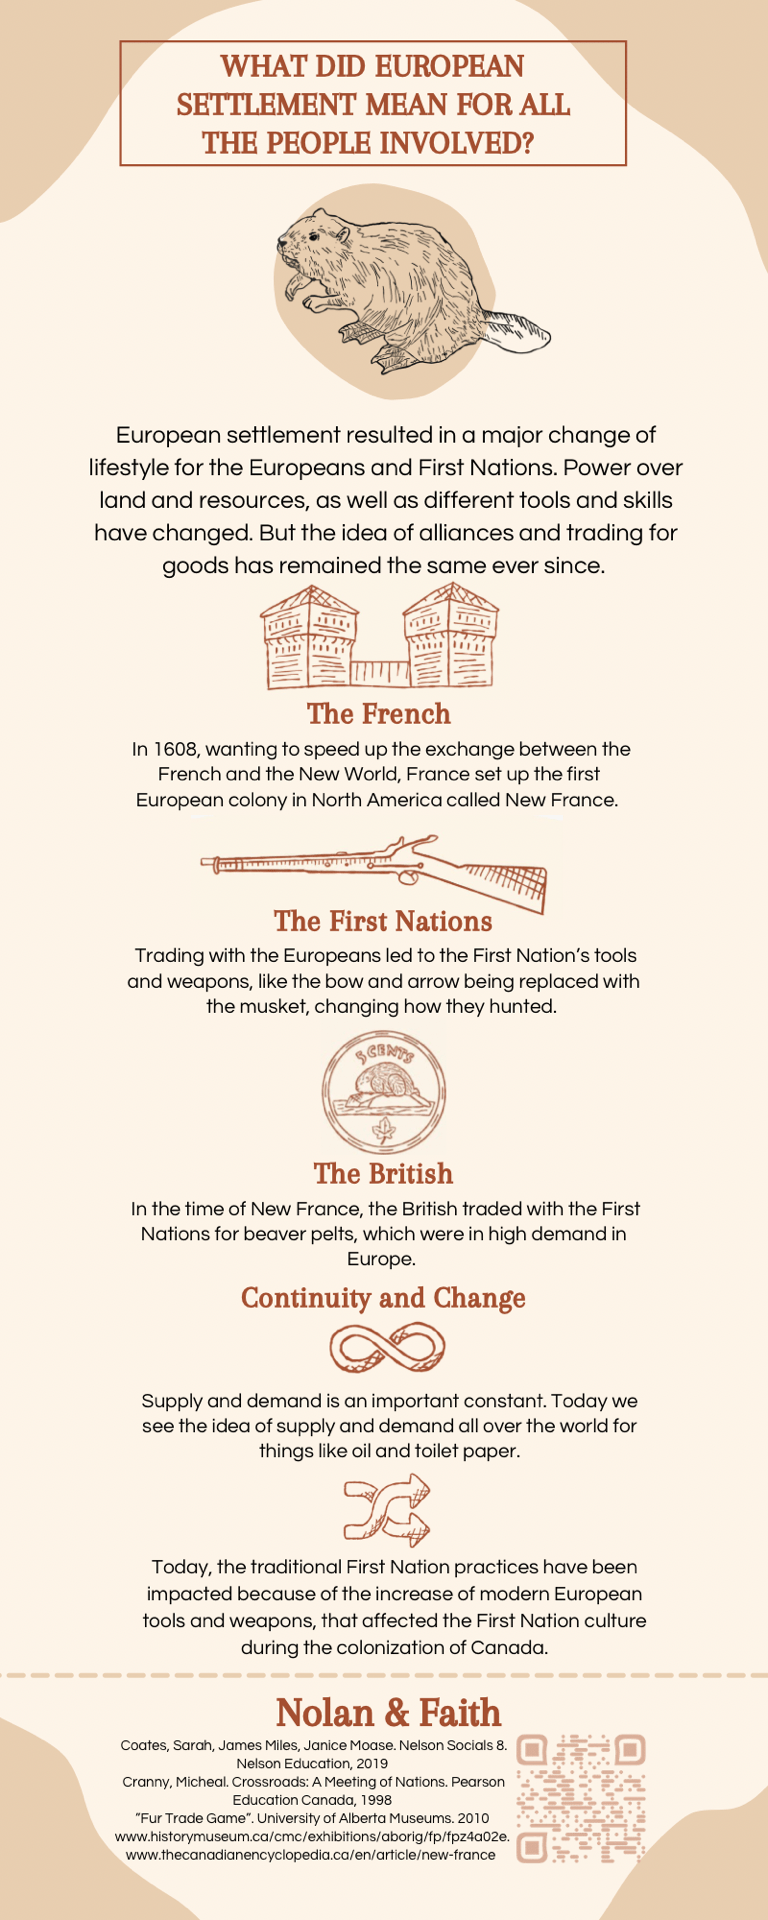
At the end of this project, I’ve come to a conclusion on the driving question. European settlement meant many different things for everybody who was involved. For the French and British, it was a way to expand their land, and become more powerful. For the First Nations, it was a way to acquire new materials that they would have not been able to get. Lives were affected by new geography and new trade options. Cultures change, and practices are going to be replaced with new ones. However, for every group involved, European settlement was a way to become wealthier. Each group was affected by European Settlement and the fur trade, and it shows in the roles that they play today.
To come to my conclusion of the driving question, we first started learning about the concept of continuity and change. Continuity and change is pretty much exactly what it sounds like. How have lives stayed the same and how did they change. We started practicing this using the history of Deep Cove.
To complete this milestone, we took a bunch of notes on the history of Deep Cove, and then wrote a reflection on it using examples of continuity and change. To be completely honest, this milestone did not go very well. Continuity and change was a new concept that I didn’t have much practice on, along with all the other requirements for this milestone, like showing an example of progress and decline as well as showing a connection through personal experiences. All things that I’m not the best at, and could still improve on. Needless to say, I tried but it was not my best work.
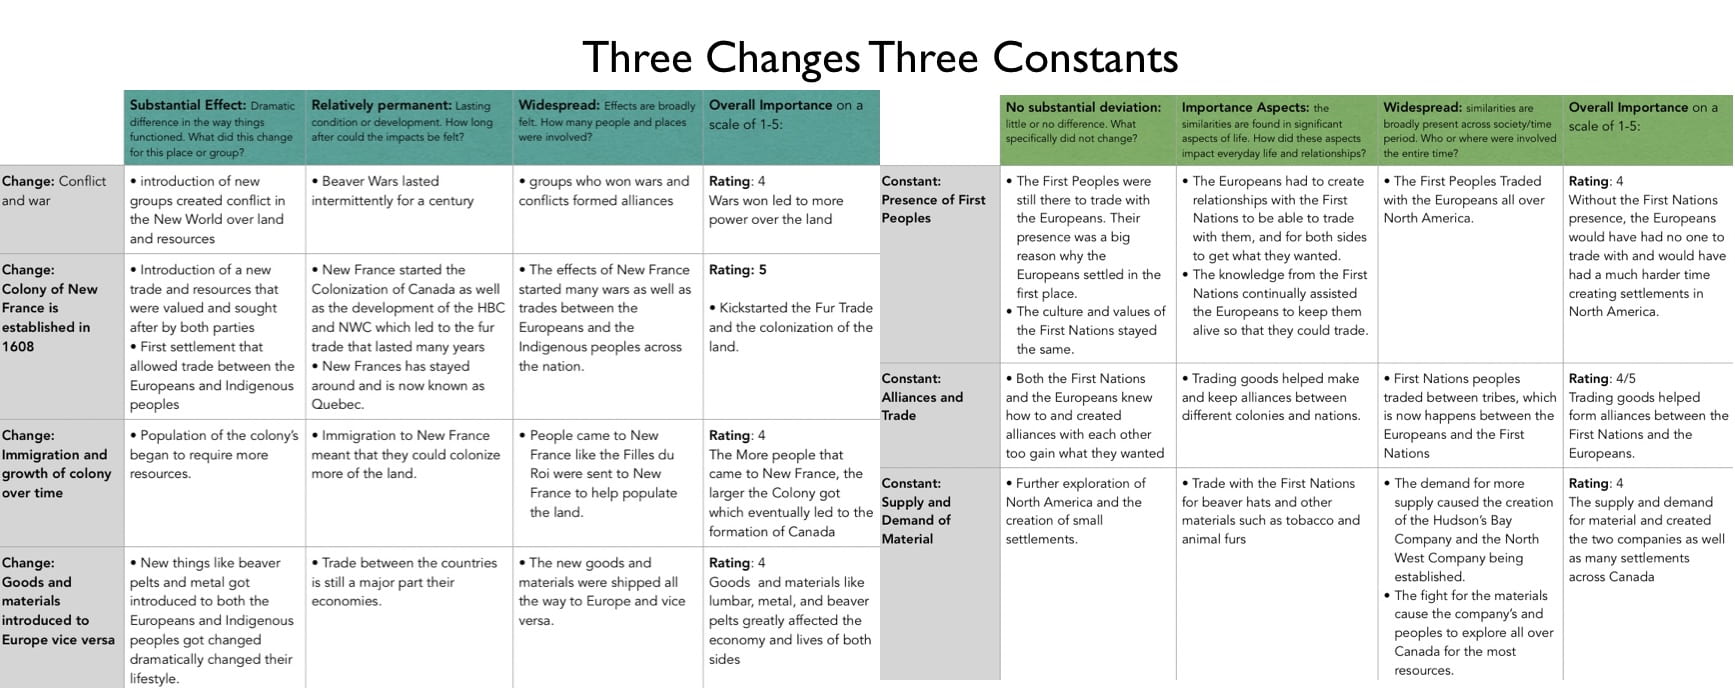
After talking about Deep Cove for a while, we started learning about the main subject of the project, European settlement in Canada, and the three groups that were involved. We did a lot of note taking and researching to figure out how people’s lives and the world were affected by three main constants and three main changes. We would then take this information and begin constructing our infographic.
(Yes, I said “our” infographic because this was a partner project. I was partnered with Faith which was a ton of fun. If you want to see her perspective, you can check out her blog post at the bottom of this post).

As you may have noticed, our infographics contain three main facts that relate to our thesis at the top. These three facts, along with everything else on the infographic ended up being very hard to write since they had to be quite short. For pretty much my entire elementary education, the more you wrote the better. However, now we have to summarize two full weeks of learning into three concise sentences and a thesis. This is one of the reasons why I found writing for the infographics so hard. There was so much to say with not enough space to say it all.

Another thing we worked on throughout the project was using evidence. This competency was used a lot in milestone three. Each fact had to be historically accurate and have evidence to support it. Using evidence in my work is something that I didn’t have much trouble with, but we did run into some problems making sure that they were historically accurate. As a historian, you can’t be theorizing and guessing what happened. You need to have proof of what happened. We ended up having to do some revisions on some of our facts because we had started writing about things we thought happened, but didn’t have any proof. In the end we revised the facts and I think they turned out a lot better and clearer after the revisions.
Thanks for listening. This project was quite hard, but we also had a lot of pizza as a reward. If you are ever around Seycove Secondary school, look around and you might find some of the other infographics posted around the school (unless they were taken down).
If you want to see my partners perspective you can find her blog here👇!
See you next time,
Nolan