We recently did our worldview and religious worldview unit, for one part we were assigned to make an Explain Everything about our worldview. But before we started to talk about our own worldview we looked at worldview itself and what a worldview is. We were informed about the seven different categories of a worldview. They are knowledge, beliefs, values, economy, geography, society, and time.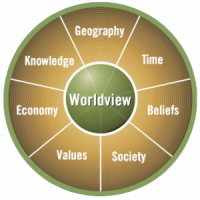 We then played a game called Isol, which was a kingdom where we had to go around and talk to the people of Isol to gain information about their worldview, and put that information into a category out of the seven listed. Once we had completed that we could work on the main task, which was to choose three of those categories and then create an Explain Everything. This was our first time using Explain Everything, but we did do a few drafts of our videos.
After we had explored our own worldview a little bit more, we then started our next task which was to learn more about a couple of different religions and then write down our findings on a chart. The religions we focused on were Hinduism, Judaism, Christianity, Aboriginal Spirituality, Islam, Buddhism, and Sikhism.
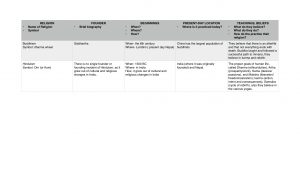
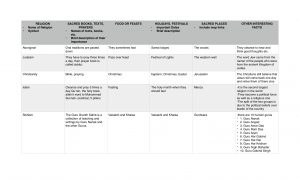

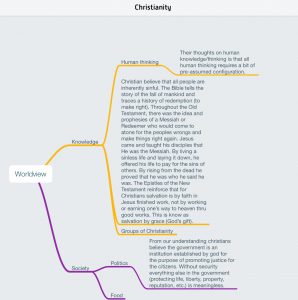
We wrapped up on that chart (occasionally referring back to it) and moved on to focusing on one religion in our groups. In my group there was Luciano, Kyle, and Caleb. We chose Christianity, and began researching, we went back and split the seven categories up between us so we each had our own part to research. But instead of just looking into each religion through online research we actually would get to visit a couple religious places of worship, and present our information to a person of that groups religion (whatever that might be) in our case it was Christianity. We each created a MindNode of the information collected.
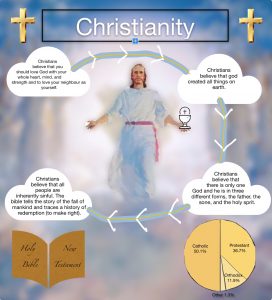
After talking with a priest on our field study and getting more information we were ready to start our infographics. We learned about what an infogarphic is first and then we began the journey of creating, getting feedback and revising. My group definitely had a challenging start and we had many issues within our group, deciding what to do and who would do it. So initially progress was slow because we didn’t communicate at all. Our first draft was definitely a work in progress as it lacked any aspects of an infographic.
We went back to the drawing board to rethink our plan and try to work together as a team. Our second draft was an improvement but still required polishing to balance the ratio between verbal content and image content. So we went onto a third and forth. Each draft was a definite improvement and we became better at working together as time went on and our work improved.
Our final draft is definitely a major improvement from the first draft and is a more professional looking infographic, as we learned how to work together as a team and delegate tasks within the team to be able to create an infographic to present as our final draft.
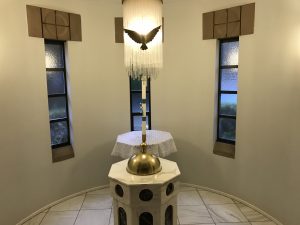
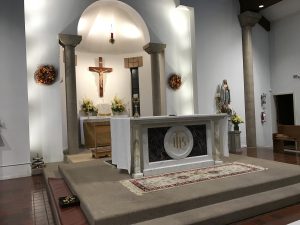
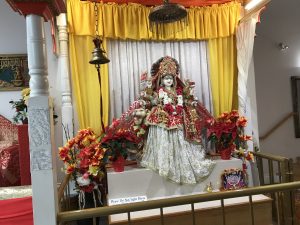
On our field studies I took many photos so here are a few

