Hello everybody and welcome back to my blog. Today, we will be discussing my final PLP exhibition as a grade 11. With the absence of a maker block in the grade 11 course, there was no chance of us being able to do a traditional blue sky project, so this time the teachers decided on conceptual art. A form of art intended to make the casual person mad, or at least that’s how I felt looking at it. So to answer my title, I’m really not sure after this unit.
The topic for our art was the Vietnam War. About a month before the exhibition, our teachers went on a field study with a lower grade class. We were left with a long list of topics to learn about in the Vietnam War. Luckily they gave us materials to learn about these topics from, so we weren’t completely left alone. There were 7 topics we had to learn about, they were: Forces that fuelled the Vietnam War, Popular beliefs and misconceptions, Leadership and decision making, Who fought in the Vietnam War, How the war was fought, Propaganda truth and the media, and The war at home. Once the teachers returned it was time to start thinking about the actual exhibition. We learned a lot about conceptual art, what it was, and how to make it. Then we had to decide what our art was to actually be about. We chose 2 or 3 people to focus on each of the 7 topics, and went from there. I chose to focus on topic 4: Who fought in the war. The main points from the topic were about the draft, draft dodgers, and the equality if the war.

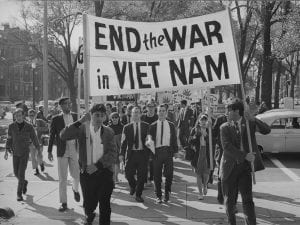
0916 extra vietnam College students march against the war in Boston. October 16, 1965. Credit: Courtesy of AP/Frank C. Curtin / PBS
For my art piece I decided I wanted to focus on the economy and how it changed over the Vietnam War. This related to my topic because the min change in the economy came from the draft. One of the ways people could avoid going to war even after being draft, was by going to university. Therefore that’s how a lot of people got out of fighting. The United States ended up sending hundreds of thousands of people to university, all because they didn’t want to fight in an unwinnable war. Here’s why this changed the economy; when someone attends university, and gets a higher education, they can now get a higher waged job. When crazy amounts of people are going to university and now becoming eligible for these high paid jobs, more jobs get created. Then with all these people making loads of money they start spending more. Which then pushes up prices of everything from fruit to cinema tickets.
So the US benefited lots from this lost war.
However as you can see in my piece above, there are people not on the economy growth line. Those are the lower class people who couldn’t afford to go to university and had to go fight in the Vietnam War.Lots of these people are either killed or severely injured in this war and couldn’t necessarily return home. However the ones that did, were in a much tougher place in the economy than ever before. Over the time of this big economy boom, the middle and upper class had both risen tremendously. The lower class people were stuck at the same place as they started. This is because they hadn’t had the education to get themselves a new higher paid job. The reason they couldn’t get this education was because they didn’t have money to begin with. So the lower class ends up in this giant loop of not having enough money to then gain money. Therefore by the end of the Vietnam War, the split between the middle and lower class was much higher than it had ever been before.
To make my piece I ended up having the people at the exhibition place all of my soldiers or grads because I felt that it was a good introduction to my piece, and got people thinking about the meaning of each piece on my artwork. I made a frame out of bits of scrap wood and drilled a hole in it to try and stick something into it to create a graph. It took many tries to get the right material to make a graph line out of however. Here’s what the first attempts at a graph looked like:
Then I tried using a metal coat hanger. It worked perfectly. It gave me enough flexibility to make a graph line out of it, but then it was tough enough to stay in that shape. It was also easy enough to duct tape onto which was how I was going to get the red part of my graph on it.
For all of my people that would end up going on my graph, I bought 60 wooden peg dolls and separated them into 3 groups of 20. This would turn into my draftees, my grads, and my soldiers. For each different group a different colour of spray paint had to be bought. So I ended up doing quite a bit of painting. Personally I believe all the dolls turned out great and looked really good on the graph.
Overall I feel like I learned a lot from this unit. Whether it be about the Vietnam War or about conceptual art. I’m also confident I’ve learned more about how economics works even without taking the course until next year. I look forward to next year and the exhibitions that will come with it.


Leave a Reply