My Vibrant Videos!

Hello, Im Theryn Strobl, and I am excited to write to you about a recent maker project, and in my opinion, the best PLP project I have participated in. In this project, I learned lots of filmmaking history and techniques on my journey to learn more about the movies! So, without further ado, here is the post.

We began this project with some brainstorming, a small lecture n some history of filmmaking, and then we were assigned a video about a hobby or skill we have. Being an avid snowboarder, I chose to make my video about that. The video contained some posters, a beginning, middle, end, and music. It was edited in an app called Clips, which I personally think is a very bad software, especially in comparison to its free counterpart, iMovie. But nevertheless, here is my final video:

A Story About Me!

The next day, we moved onto skill #2: a silent movie. This movie was supposed to recreate an old black and white movie, with no sound (other than a soundtrack) and not to long, making use of a certain poster (it’s the old-timey looking one). I made mine about finding the last lego peice in my contraption, and I think I conveyed the story using the limited storytelling options quite well.

The Last Piece

The next product in our moviemaking journey was a tutorial video that teaches how to do something. In the end, most of them were goofy and taught a very basic skill, but they could still do their desired job, so thats a win. In my group were Dana and Brooke. So, for the first step, we got started on our storyboard, which went through many painful revisions until we got it approved.

Then, we filmed and edited our final video.

How To Tie Your Shoe

And then, for the last and most fun skill, we were put into groups of three, and givin around two hours to make a short “special effects sequence”. The goal of this was to use special effects to help tell our story. We had some preparation beforehand to figure out a story and plot, but everything else had to be finished in the allotted time. This was also in a small group, and I was with Fraser and Nolan. So, we set to work designing a quick storyboard, and then got to filming. We filmed many takes, and got quite the blooper reel, but in the end, this was our film:

The All Great Magical iPad Heist

Then the entire class shared their videos in a mini film festival. An honourable mention of mine is this video:

Overall, this was probably one of my favourite PLP projects ever, and I actually enjoyed learning how to communicate using the medium of film, and creating truly vibrant video.

Thanks for reading my post! Make sure to stay tuned for the next one, I’ll see you later. Bye.

A Project about Poetry

The latest PLP project was all about poetry. I learned about myself, poetry, and what made the me right now. So, without further ado, here is the post.

We started this project with a cool entry event were we put together pieces of a chopped up poem and answered questions about the poem with it groups. From the very start, we knew we would be making a book of poetry, and the first assignment was to create 2 poems: a simile poem, and a metaphor poem.

The driving question for this project was “How might I construct text that shows who I am right now?” The answer to this question is almost anything! Poetry, art, writing, photography, drawing and creating all are forms of self expression that can help anyone show or learn who they are.

On the second day back, we learned about two concepts: juxtaposition, which is basically just surprising readers with two contrasting things, and comprehending poetry, in order to understand the message of the poem. Each day we got assign one or two new poems. That day, they were a found poem: creating a poem out of previously found material, and three haikus, which are poems were the lineage 5 syllables long, 7 long, then back down to 5.

On day three, not much happened we were assigned a new poem: an imagery poem. This poem is supposed to vividly describe one image.

On day 4 we were assigned a Sunday poem, a poem about the sounds of your worldview,and in class we practiced making silly sounds. (It sounds immature, I know) we were also tasked with starting to put our poems into out book.

In the last two days of this project, we were assigned three poems: an experience poem that describes an experience that shaped your worldview, a self portrait poem that describe who you are now, and a personification poem that describes what worldview is using personification. The self portrait poem can also be used to answer the driving question. And, on top of all that, we had to create and record meaning statements for all our poems and make complementary texts that go next to our poem.

After staying up very late for many days, I completed my book (which can be found below) and concluded this project. This project seemed shorter than previous ones, so this post is more snappy, but I hope you enjoyed it. Also, I feel like there was not enough time for this project, and I wish there was about 2-3 more classes in it.

Thanks for reading my post! I hope you enjoyed it. See you in the next one.

Correlation Vs. Causation

As of two days ago when writing this, the latest PLP project just ended. I am writing today about that project, the correlation and causation project. in this project, I learned how to identify correlation and causation, and make surveys and show the results. So, without further ado, here is the post.

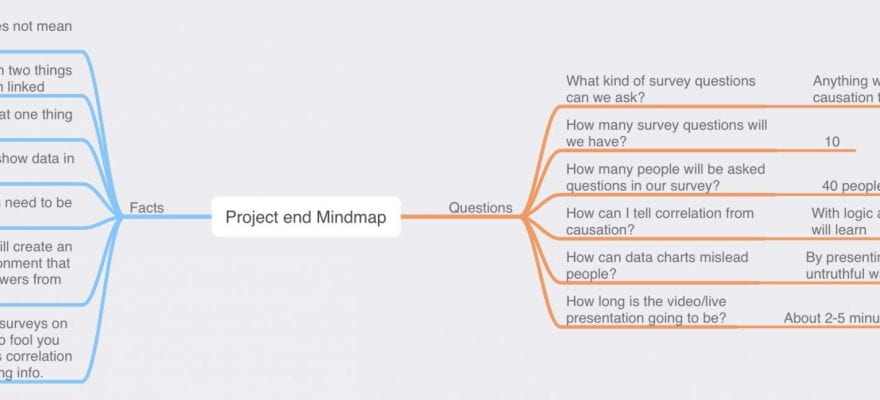
To kick off this project, I started the same way I usually do: with a mind map. This Mindmap graphs all the existing knowleadge I have and the question I have onto paper (or pixels).

This project was about correlation and causation. Correlation is a statistical term that evaluated the degree at which two or more things are related. Causation is when those things actually cause eachother.

The final product of this project is a presentation featuring survey results on graphs that show correlation and causation. For the next major milestone in this project, me and my partner had to make a plan for our survey. We had some ideas for what our survey could be, and in the end we made this:

After making this, we assembled and wrote the questions into a survey we made using google forms. We sent this form our via Basecamp, Snapchat, and iMessage. We received 40 responses in total, all of which are 13-18 years olds. We put our results onto graphs, and found no correlation with our original plan. But, we didn’t just ask four questions, we asked more so that we could look through the data to find correlations (almost) no matter what. And with that, we found these two correlations:

Correlation 1: Friend height VS. Your height
Correlation 2: Perceived height VS. Actual height

Finally, it was time to start working on our final presentation. We started out with an outline of what our presentation would look like

And after that, we made out final presentation, and nothing to notable happened with this.

And then we presented. The presentation went smoothly, though I think we could’ve improved upon it by making our data more clear.

And for the curricular competencies for this project:

Planning and conducting:Select and use appropriate equipment, including digital technologies, to systematically and accurately collect and record data


Two correlations are found using well crafted survey results. The survey results and correlations are are displayed and explained through presentation software. At least two graphs are analyzed to confirm correlation.

Our presentation clearly showed our survey results, correlations and featured two graphs

Communicating and Representing: Use mathematical vocabulary and language to contribute to mathematical discussions

Verbal and pictorial explanations help the audience to understand the circumstances where both correlation and causation are present, and also where a correlation is falsely associated with causation. A Logical explanation for causation is explored for one case.

We showed our exploration into one of the correlations to prove causation which follows a logical course. We also have verbal and pictorial explanations that help guide the audience to a conclusion.

Applying and Innovating: Contribute to care for self, others, community, and world through individual or collaborative approaches

Good ethics are followed when conducting surveys. All class time is used efficiently for learning without distractions.

I used my time wisely and only missed one deadline this whole project.

Well, thanks for reading my post, and I hope you enjoyed it. Stay tuned for the next one.

My partners Max’s blog

Atoms

As you can probably tell from the title, this project was one about atoms (and molecules, Kenetic energy, etc…). We spent about three weeks learning, coding and thinking to answer the driving question for this project: how can the behaviour of matter be explained by the Kinetic Molecular theory and the Atomic theory? So, without further ado, here is the post.

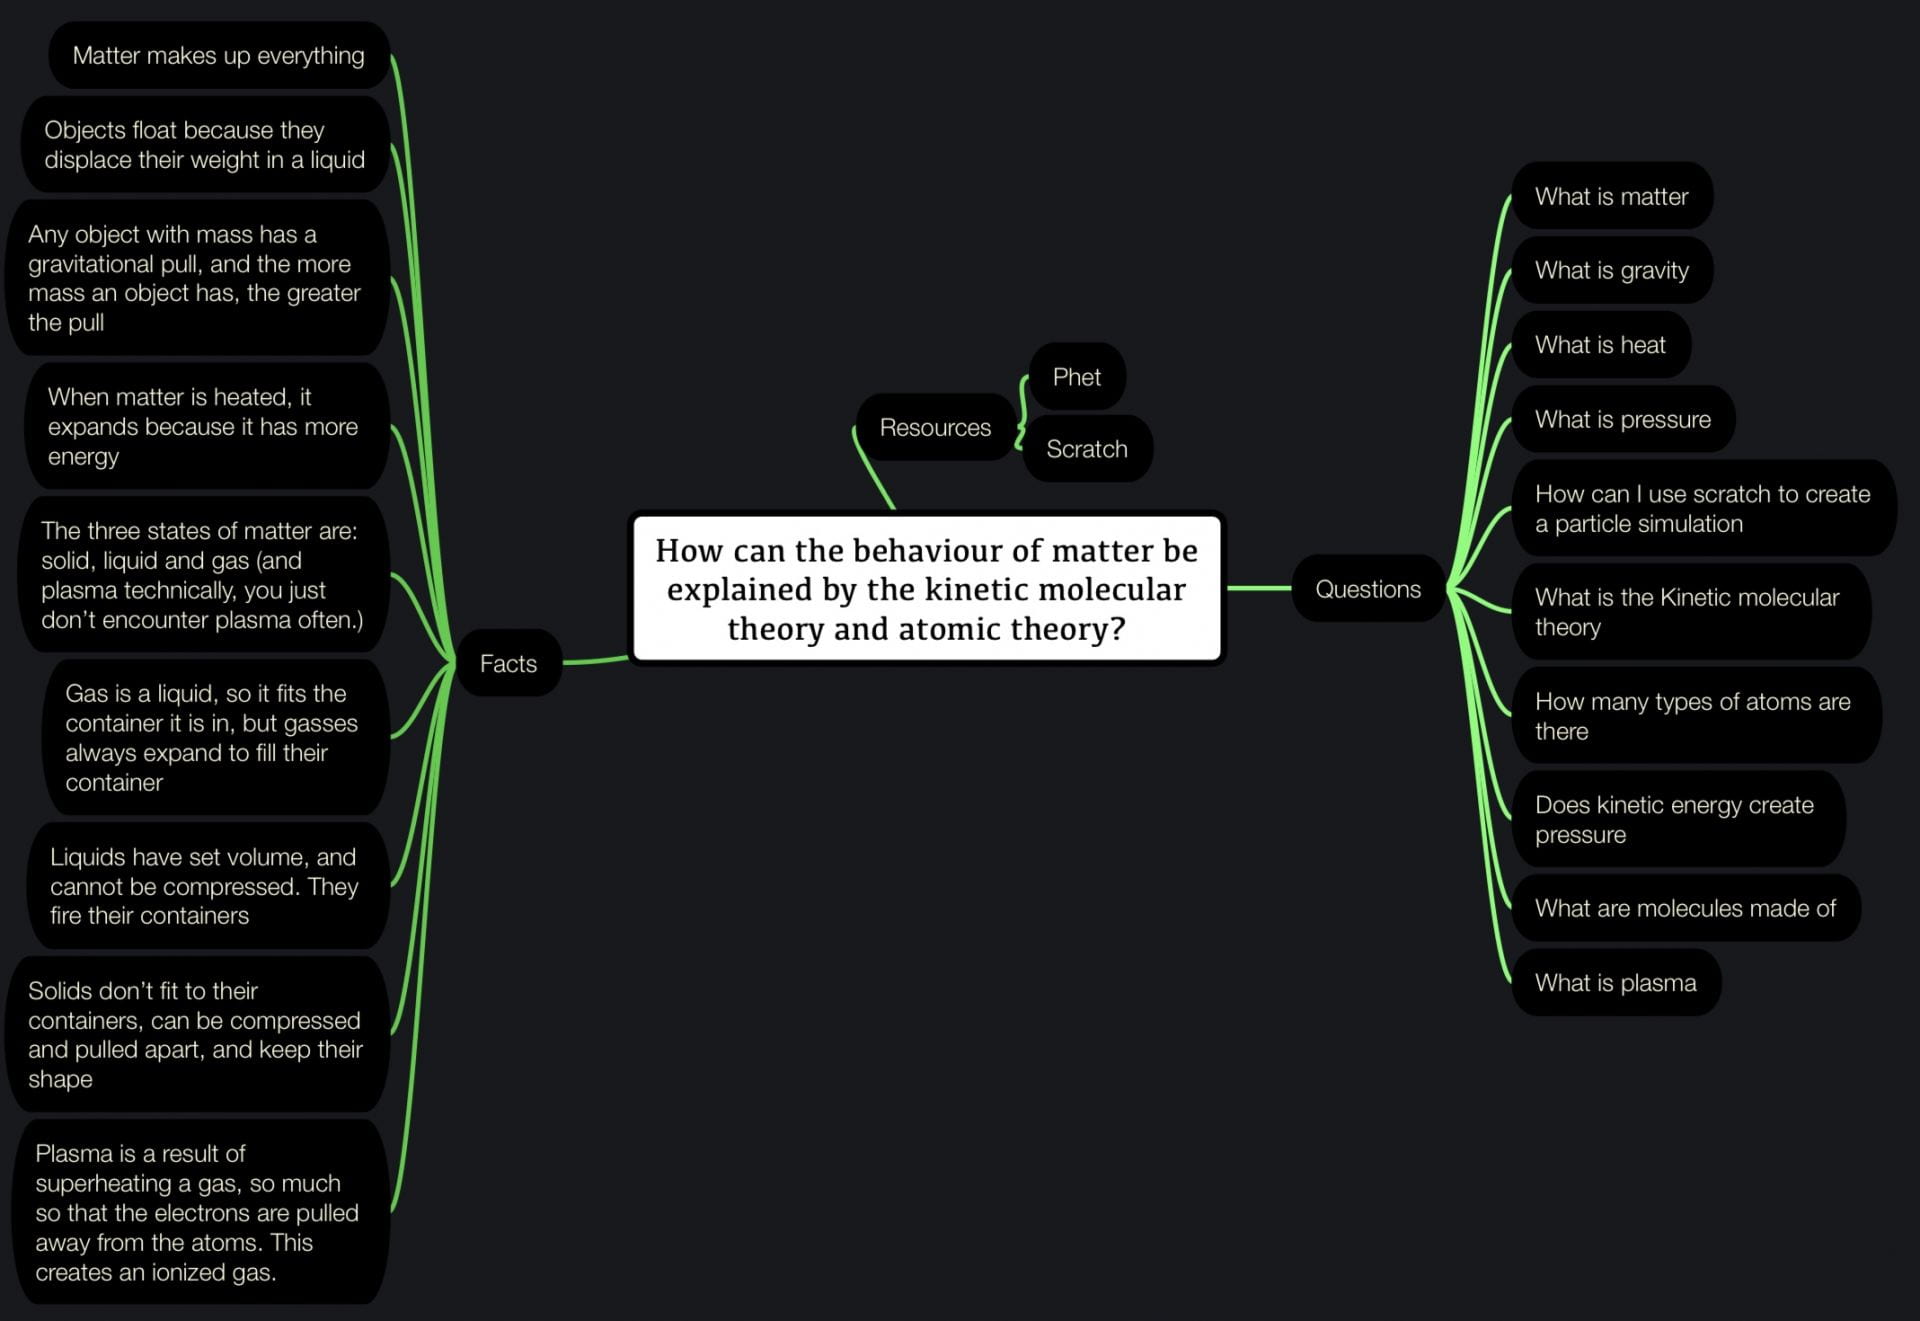
We started this project with a mind map and an experiment/magic trick. We wrote the mind map about what we already knew about matter, and then all of our questions about it.

Project start mind map

For the demonstration of atomic and molecular theory, the teacher performed a trick using a sealed bottle filled with water and an eyedropper.

The trick works by utilizing pressure. When the bottle is not squeezed, it looks like this:

Eyedropper at the top

But when the bottle is squeezed, the pressure increases, forcing the eyedropper down, and if you are subtle, it looks as if you magically made the eyedropper go down.

Squeezed bottle with the eyedropper down

One really cool activity was called the gemstone identification challenge. The whole class partnered up to measure the volume, weight, and then calculate the density of a few stones. The class average density was 3.74 grams per millemeter, and the closest density to that was that of colourless topaz, so we confirmed that the stones were colourless topaz.

Gemstone ID sheet

For milestone 2, we created accurate models for our coded project. In order to make our simulations or games follow this competency: Several different atoms/molecules, different states of matter, and particle motion are represented in the finished product. A historical model of the atom is chosen and implemented, we created some sort of model and text.

In order to create realistic and functioning models of atoms, molecules, and in my case quarks, I worked on three slides of information and graphics. It took three other versions to create to the one shown below.

The next week was mostly spent learning more about matter and coding or refining our scratch projects. Then we did milestone four, which was a coding plan for the rest of the project. This was my milestone four coding plan:

Features:
Press space to show Bohr models
Press M to mute music
Press N to unmute music
Press Q to create more clones
Press 1-3 to change molecule type
Gravity that can be turned on and off
Click the reset button to reset the simulation
Use the temperature slider to change how fast the particles move.
Setting the temperature to zero will stop the particles from moving, other than gravity acting on them.
You can create different states of matter by adjusting the temperature and gravity.
you can adjust how much gravity there is.
You can move between subatomic particle models, Bohr models, and no models by pressing space bar twice This kinetic molecular theory is included in the simulation when the particles move. They follow the Kinetic molecular theory.

After creating a plan, I continued coding my scratch project until it was completely done and polished. If you want to check out my simulator, click here. After all was said and done, I created a summative mind map of the project, which helped round of the end of the project.

As with all projects, there were curricular competencies which you can see below:

Questioning and Predicting: Demonstrate a sustained curiosity about a scientific topic or problem of personal interest.

All class time is used efficiently for learning without distractions. I used all my class time efficiently, and I am very proud of my final product.

Scientific Communication: communicate ideas, findings, and solutions to problems using scientific language, representations, and digital technologies.

Several different atoms/ molecules, different states of matter, and particle motion are represented in the finished product. A historical model of the atom is chosen and implemented. I have three different molecule designs: H2O (water), carbon dioxide (CO2), and ozone (O3). I also have three Bohr models of the elements: carbon, hydrogen, and oxygen, And finally two subatomic models of protons and neutrons.

Reasoning and Analyzing: Use logic and patterns (including coding) to solve puzzles and play games.

An interactive Scratch coded matter simulator or game is created with logical conditions and functional user controls. I created a simulator with four variables that the player/user can change, and extra aesthetic changes as well. The user can change limits all the variables, and the layout is logical and easy to use.

Thanks for reading my post! I had a great time doing this project, and i am sure to do more, so stay tuned .Even though I have featured it already, just in case, here is the link to my scratch matter simulator. Thanks to my friend Noah for all the coding help and feedback. If you want to check out his blog, click here. See you in the next post!

Exploring European Exploration

Welcome to another summative post. Today, I am going to talk about our latest project on European Exploration. This was a three weeks long, and consists of five milestones. So, without further ado, here is the post.

The driving question for this project was: What Did European Settlement Mean For Everyone Involved? To answer this question, there are two thing you need to know first: what is European settlement, and who was involved, and this post is documenting how I found the answer to this.

We kicked off this project with our first milestone: a stream-of-consciousness writing about European Settlement. This was the first assignment of this project.

We did some other activities to build our knowledge, and then did milestone two, a sheet were we used evidence to rank events by significance on a chart. This is what it looked like:

Continuity and Change sheet

Throughout this project, me and my partner have been writing almost everything in one shared document. We have written scripts, notes, photos, content, and sources.

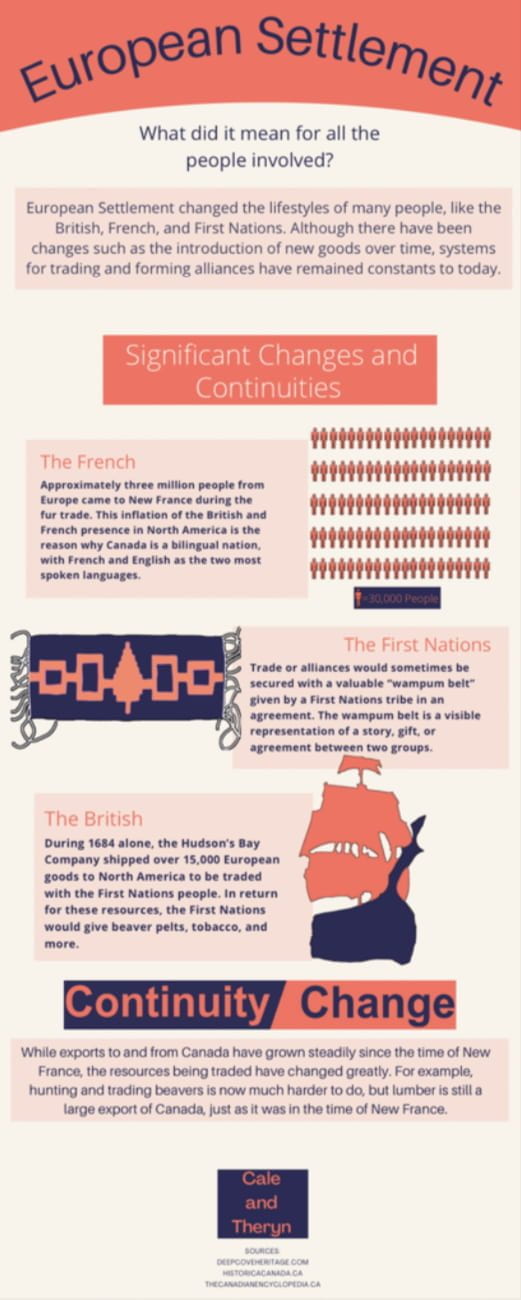
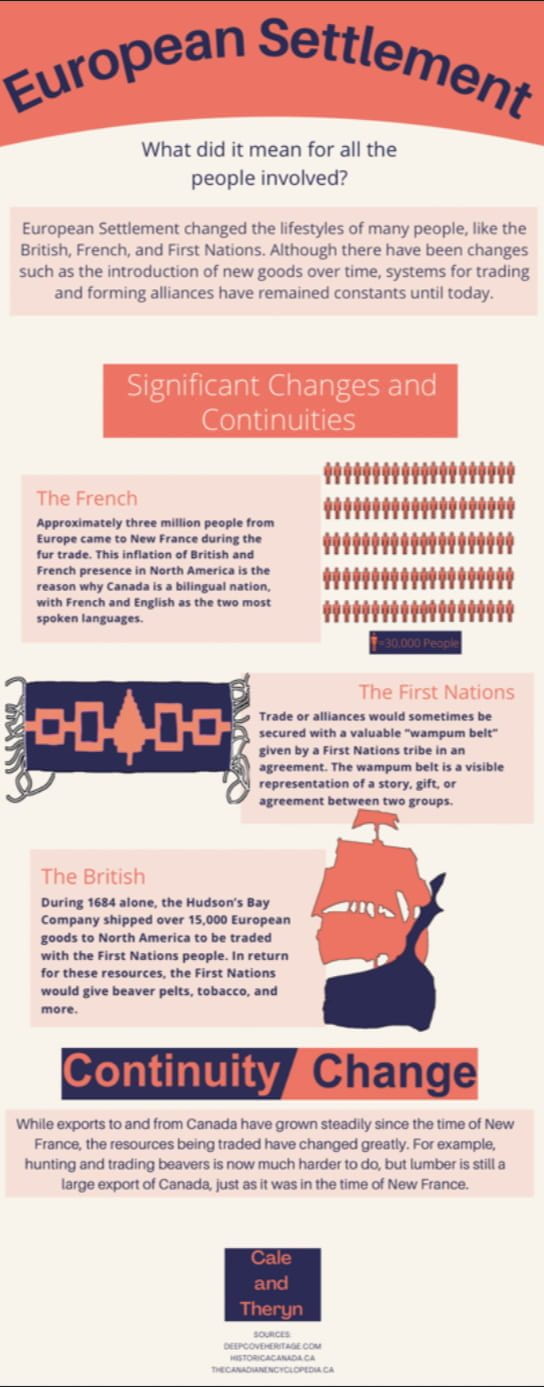
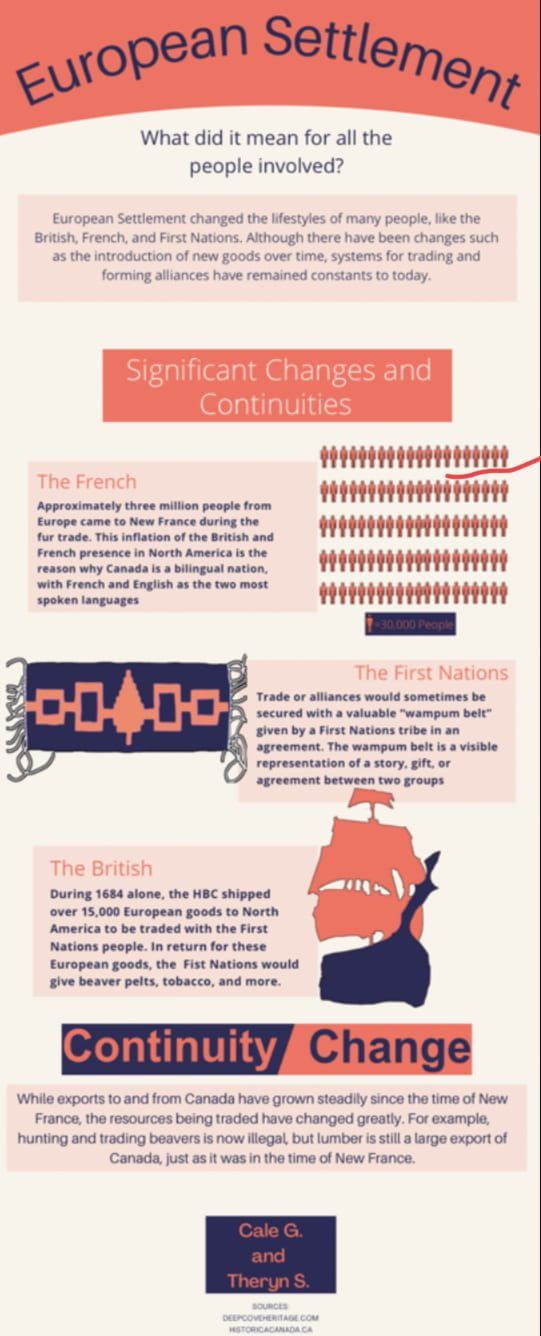
After we finished researching and creating our facts and graphics, we handed the rough infographic in as milestone three.

Milestone 3

Over time, me and Cale refined our infographic, and created six different version before the final product was created.

We then created a script, description, title, QR code, and Keynote magic move for our YouTube video.

Video Script
YouTube Information
QR Code To Video

Using all of this, we created the video which the QR code on the infographic leads to. You can find this video here.

And finally, we worked on putting all 26 infographics up around the school. We decided on were to put the infographics and which ones should go together, then put them up!

And that brings us to now, where I can answer the driving question: What Did European Settlement Mean For Everyone Involved? Well, the answer is complicated, because of how broad of an event it was. In my infographic, I focus on one aspect of it: alliance and trade. European settlement affected the First Nations, British, and French. Even today, and I’m sure for long afterward, trading will remain a constant. But what resources that are being traded, how they are traded, and the people trading them will always be changing. Alliances are crucial to humanity, and we are able to accomplish much more when we ally together. European Settlement gave new resources, trading routes, and opportunities for alliance to everyone involved, and that completely changed history for long after.

Thanks for reading my post! If you want to check out my partner’s experience with “The More Things Change” project, click here. Anyways, thanks for reading my blog and see you in the next post.

Destination Imagination!

In this term as a challenge, we did something that PLP has done for more than five years! It is a challenge that is completely done by students, and consists of an instant challenge and a team challenge. I cannot tell you guys about the instant challenge because it could give other teams an advantage. But, since I can still talk about the team challenge, talk about it I will do.

If you don’t already know what DI is, they are an organization that hosts global project-based learning competitions for students to compete in. If you want more information, click here. As PLP students, we compete in these challenges, and for me and my group, we got the technical challenge: The Next Level. In short, there are four different categories; technical, scientific, fine arts, and engineering. The technical challenge was about making a specific storyline in a video-game style.

To start it out, we made sheets of each team members strengths and weaknesses, and decided on general roles for the project.

We also completed interference contracts, which are forms that state that we will not cheat, tell others about the contract, or use other people’s ideas. We completed other worksheets to decide on the storyline and specify things that must be completed.

Team choice element inventory #1

All throughout this project, our team hub for communication was constantly being updated with what has to be done, what has been done, and certain events to prepare for. Once our group decided on what storyline to use, we wrote the first version of our script. This script would be revised later to check certain boxes, but the general idea was always the same.

Then, it was time for the instant challenge to be released. I cannot talk about the instant challenge, so I will skip over it. But, I can say that it was quite a hustle to get done, but we did do it in the end.

We also had to complete tournament data forms, which include an expense report and questionnaire, as well as safety forms.

We also completed meeting notes every time our group met, resulting in thirteen individual notes.

Meeting notes

After we finished writing our final script we moved on to filming. The script had three other revisions before we used the final one. In collaboration with Noah, we made the tool (I made the lower body, he made the upper body) and worked together to refine it. Here is a small worksheet reflecting on my D.I. Experience:

I used to think/Now I think

We finally started filming on the last week before we put in our team challenge video. Our editor had a very small amount of time to edit this, so shout out to him! We also filmed and scripted a Q&A video to go along with our main one. We finished the final challenge video, and you can check it here.

Go check my group member’s blogs as well:

Sabrina’s blog

Noah’s blog

Patrick’s blog

Xander’s blog

Ariane’s blog

Also, here is the full tournament award stream. Anyways, thanks for reading my post. See you next time!

Argh, Matey!

For our second project this quarter, we did a project about the Age Of Exploration, and this is a summative post About my learning throughout this project.

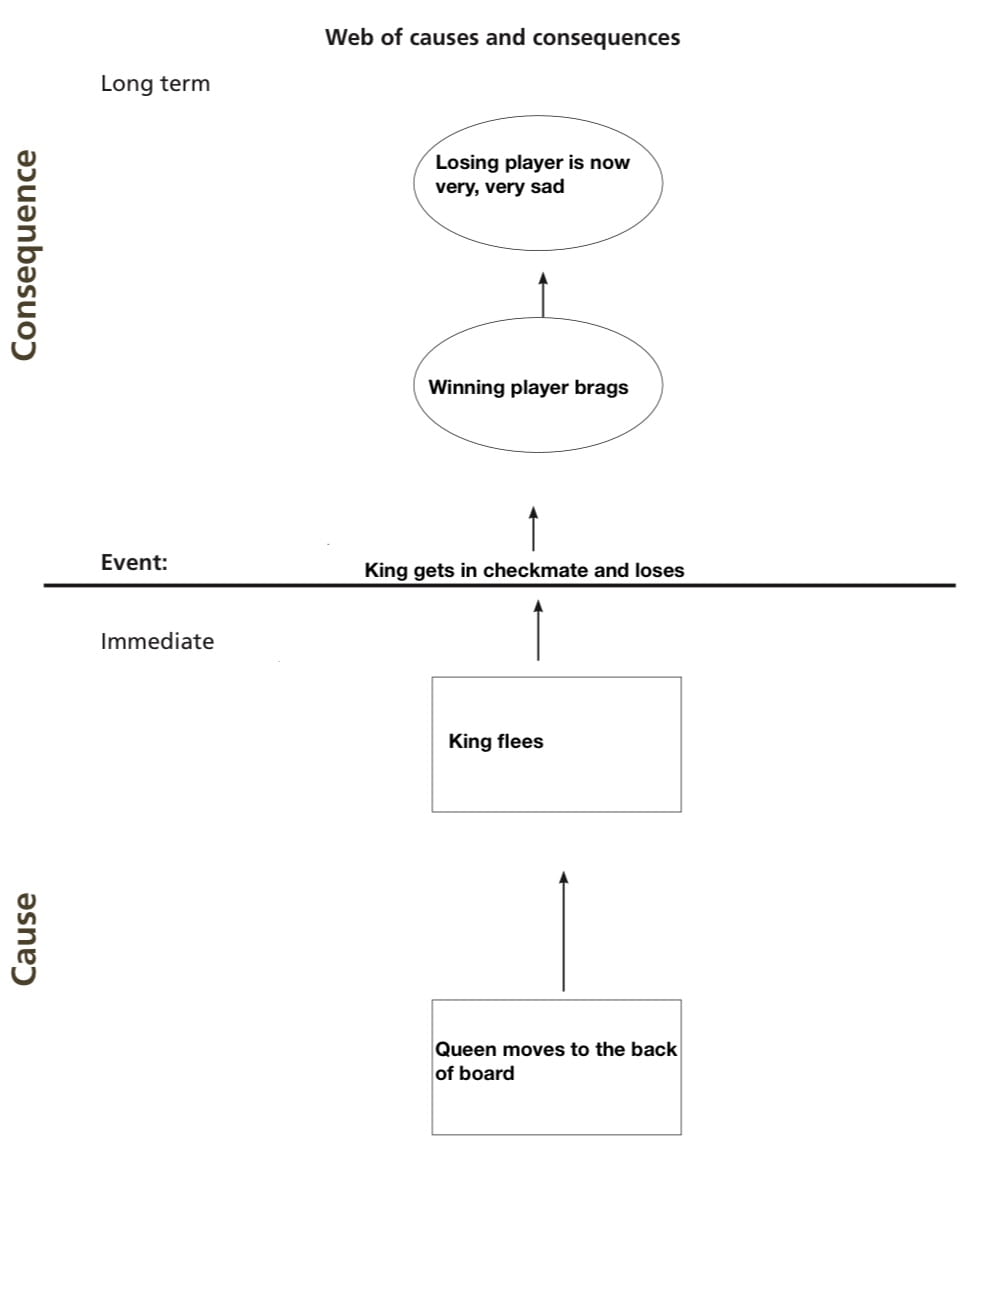
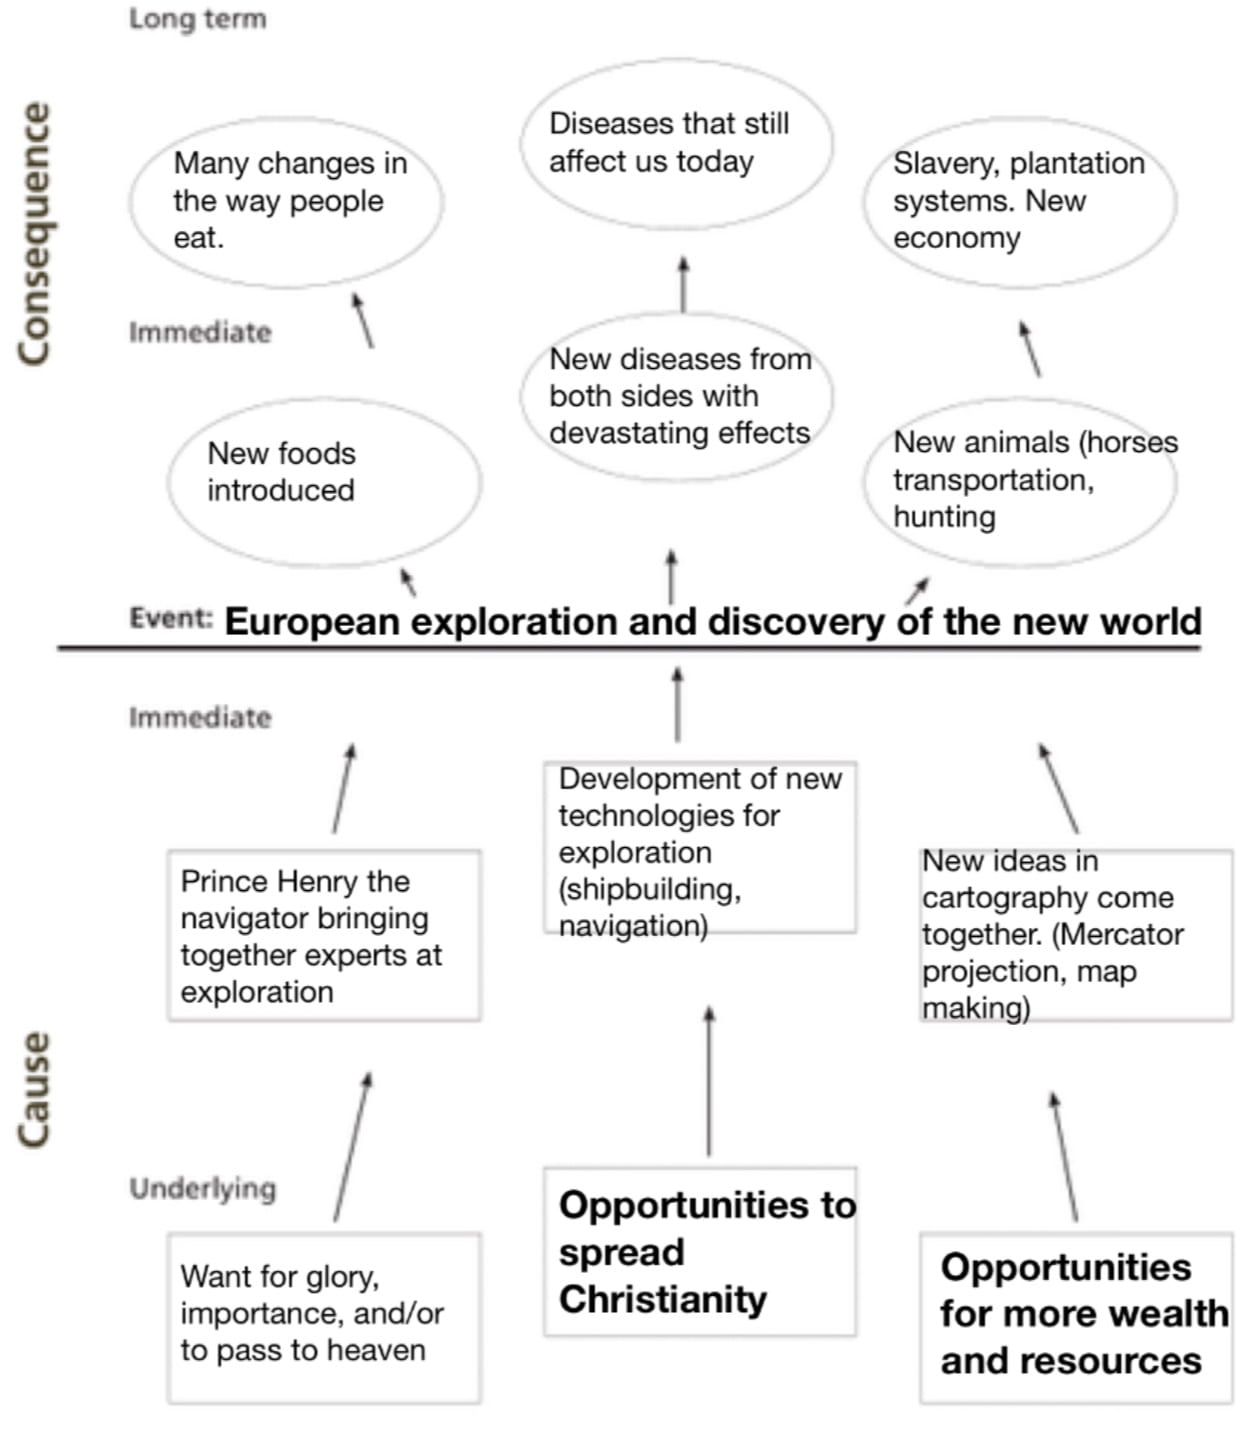
To kick off this project, we watched a pirate movie based off of a real hijacking. We talked about pirates a bit, and then learned what cause and consequence are. Cause and consequence is how all events happen; they have a cause, and then more events because of it. We made webs of cause and consequence to practice this skill:

Chess web of cause and consequence

The whole project was about teaching us about the causes and consequences of European exploration. The driving question was: “What Was The Impact Of Global Exploration?”. To answer this question we first, you guessed it, learn what global exploration is.

Every day, we got a lecture on exploration, from the invention of new inventions like the caraval or astrolabe, to people who completely changed history like Christopher Columbus, or prince Henry the navigator. We did different reflection activities to help absorb the knowledge, like these below:

Sketch and Tell

Then, we did milestone 2, which was a large web of cause and consequence about the European exploration.

Large Web

We finally used our device skills to create a augmented reality presentation. This presentation was of a story written by me about the age of exploration.

And the answer to the driving question: the impact of global exploration is in the language we speak, the food we eat, and the things we do. The merging of cultures from global exploration caused many, many new things, and predicting the world without global exploration is nearly impossible, considering how much it changed the world.

Now, this project was a great journey, and I learned tons about our history. I also had tons of fun writing this post as well. You might want to check out some of my classmates views on this project too!

Sepaus

Colton

Thanks for reading my post! See you in my next one.

Student blogging challenge: the ACTUAL last day

Today, I am writing about the blogging challenge I have been doing for this whole quarter. So without further ado, here is the post!

When we started this project I will admit it: I really did not like the sound of making one blog post every day until the end of the quarter. But, as time went on, writing the blog posts quickly grew on me, and by the end, I really enjoyed writing the posts.

The first post in the challenge was an: “embedding content” post, and I wrote it about snowboard bindings. This post was pretty cool, but it was not my favourite post I have done. Honestly, my favourite post of all time is my blogging challenge day ten post, i am just really proud of all my photoshops, and had a ton of fun writing it.

I learned tons about embedding content, writing, and creating digital content in general. If you look at my first post in the challenge to the lat post, my growth is obvious. I will keep updating my blog and some previous posts, so stay tuned!

This has been an amazing challenge, and I appreciate you for reading along with me. See you in the next post!