Destination Imagination: In Person

The latest project in the PLP 9 classroom was DI (Destination Imagination). As you may recall from last year, DI is a worldwide competition that students can participate in, and PLP participates every year. This year, I was put onto the scientific team, where our challenge was to create a performance where our characters get stuck in a micro world and have to use the help of a mysterious object to get out. So, without further ado, here is the post.

To start this project, you need to know some things first: my group members were Teva, Ava, Ariane, and Julian. If you want to read them, the full rule book for this challenge is here, and the general rules for DI are here. We had around three months of time from when we first started DI, and the tournament was on April 2nd. The project did go over spring break though. So now, with that out of the way, I can continue.

Stage 1: Recognize

We started off the project by deciding roles and responsibilities, and learning about each others strengths and weaknesses going into the challenge. This can help up work better as a team to conquer any challenges along the way.

Stage 2: Imagine

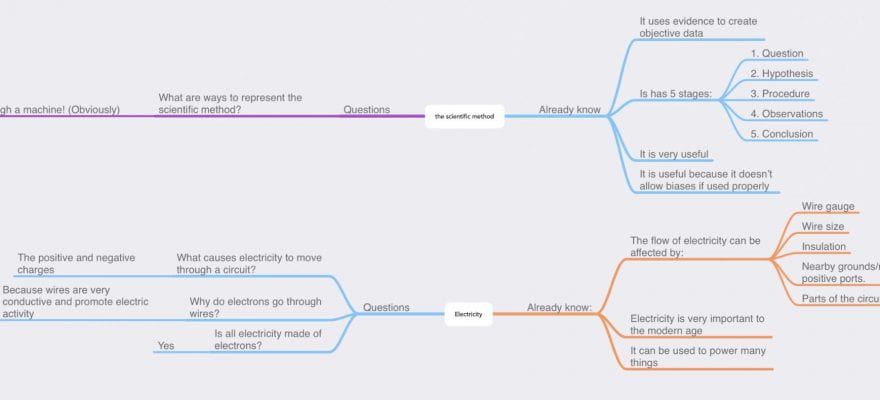
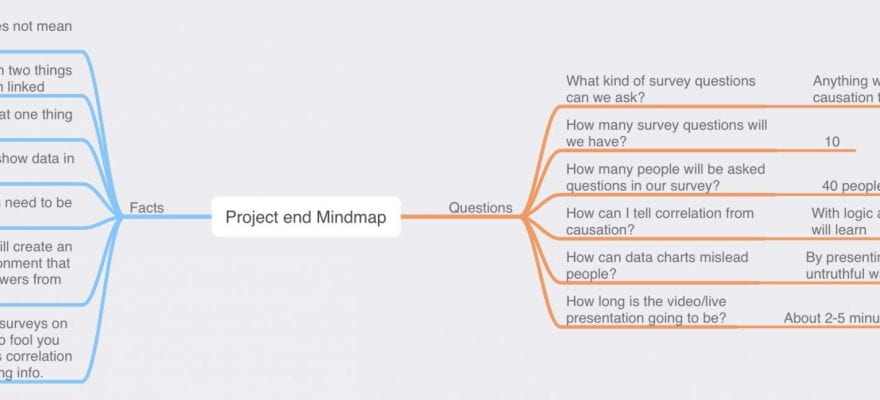
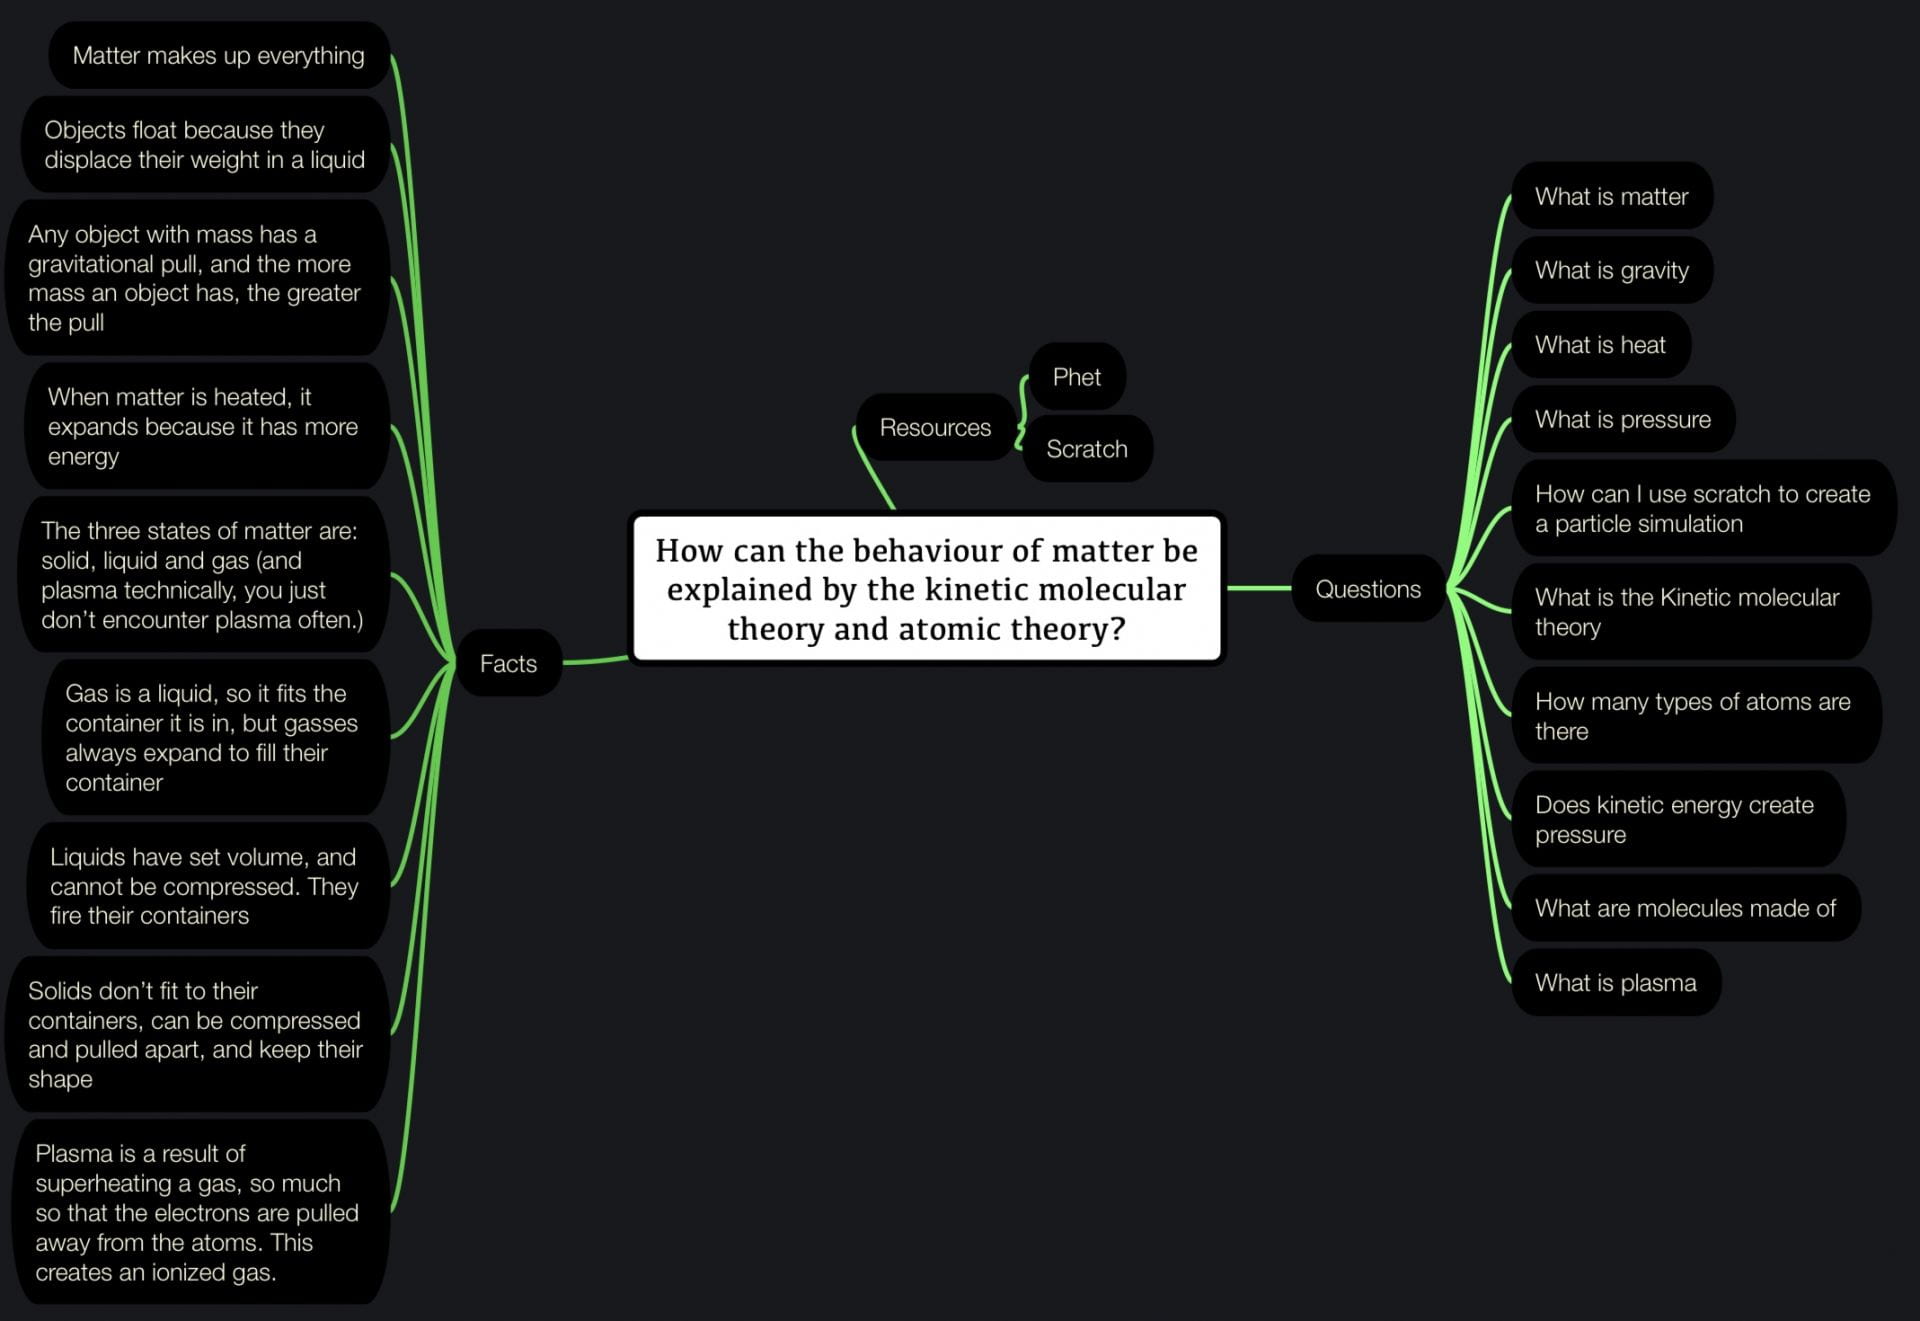
Then, we did a around 3.4 metric tons of brainstorming; any idea, from story, technical execution, mechanisms, the visual effect, anything.

After lots and lots of ideas, it was time for a crucial step in making the final product: planning. This involves choosing which ideas will make their way onwards, as well as deciding how and when they will get used. Then, we created a first draft of the script, which was revised many times.

Stages 3-4: Collaborate, Initiate, an Assess

Now, it was time to start creating our final props and presentation. The rest of the project was honing in and improving our presentation until it was perfect. (Although it wasn’t perfect by the time we finished). The Final Script is here.

Stage 5: Evaluate and Celebrate

And finally, it was time to present. All our work has led up to this. Our team went to St. George’s Senior for the final tournament, but our struggles didn’t end there. We forgot to bring a tablecloth, and that may not sound big, but thee tablecloth was going to help obscure a prop, and without it, our set change might not be very clear. But, 30 minutes before our presentation, we taped pieces of paper together to create one large sheet, and with everything prepared, all we could do is present.

And our presentation went great! Below is our groups reflection on what went well, and what went… not as well.

+ / – chart

Again, so much thanks to my DI team of Teva, Ava, Ariane, and Julian. Overall, I learned so much this year in DI, and am surprised that I liked it. See you in the next one, and thanks for reading.

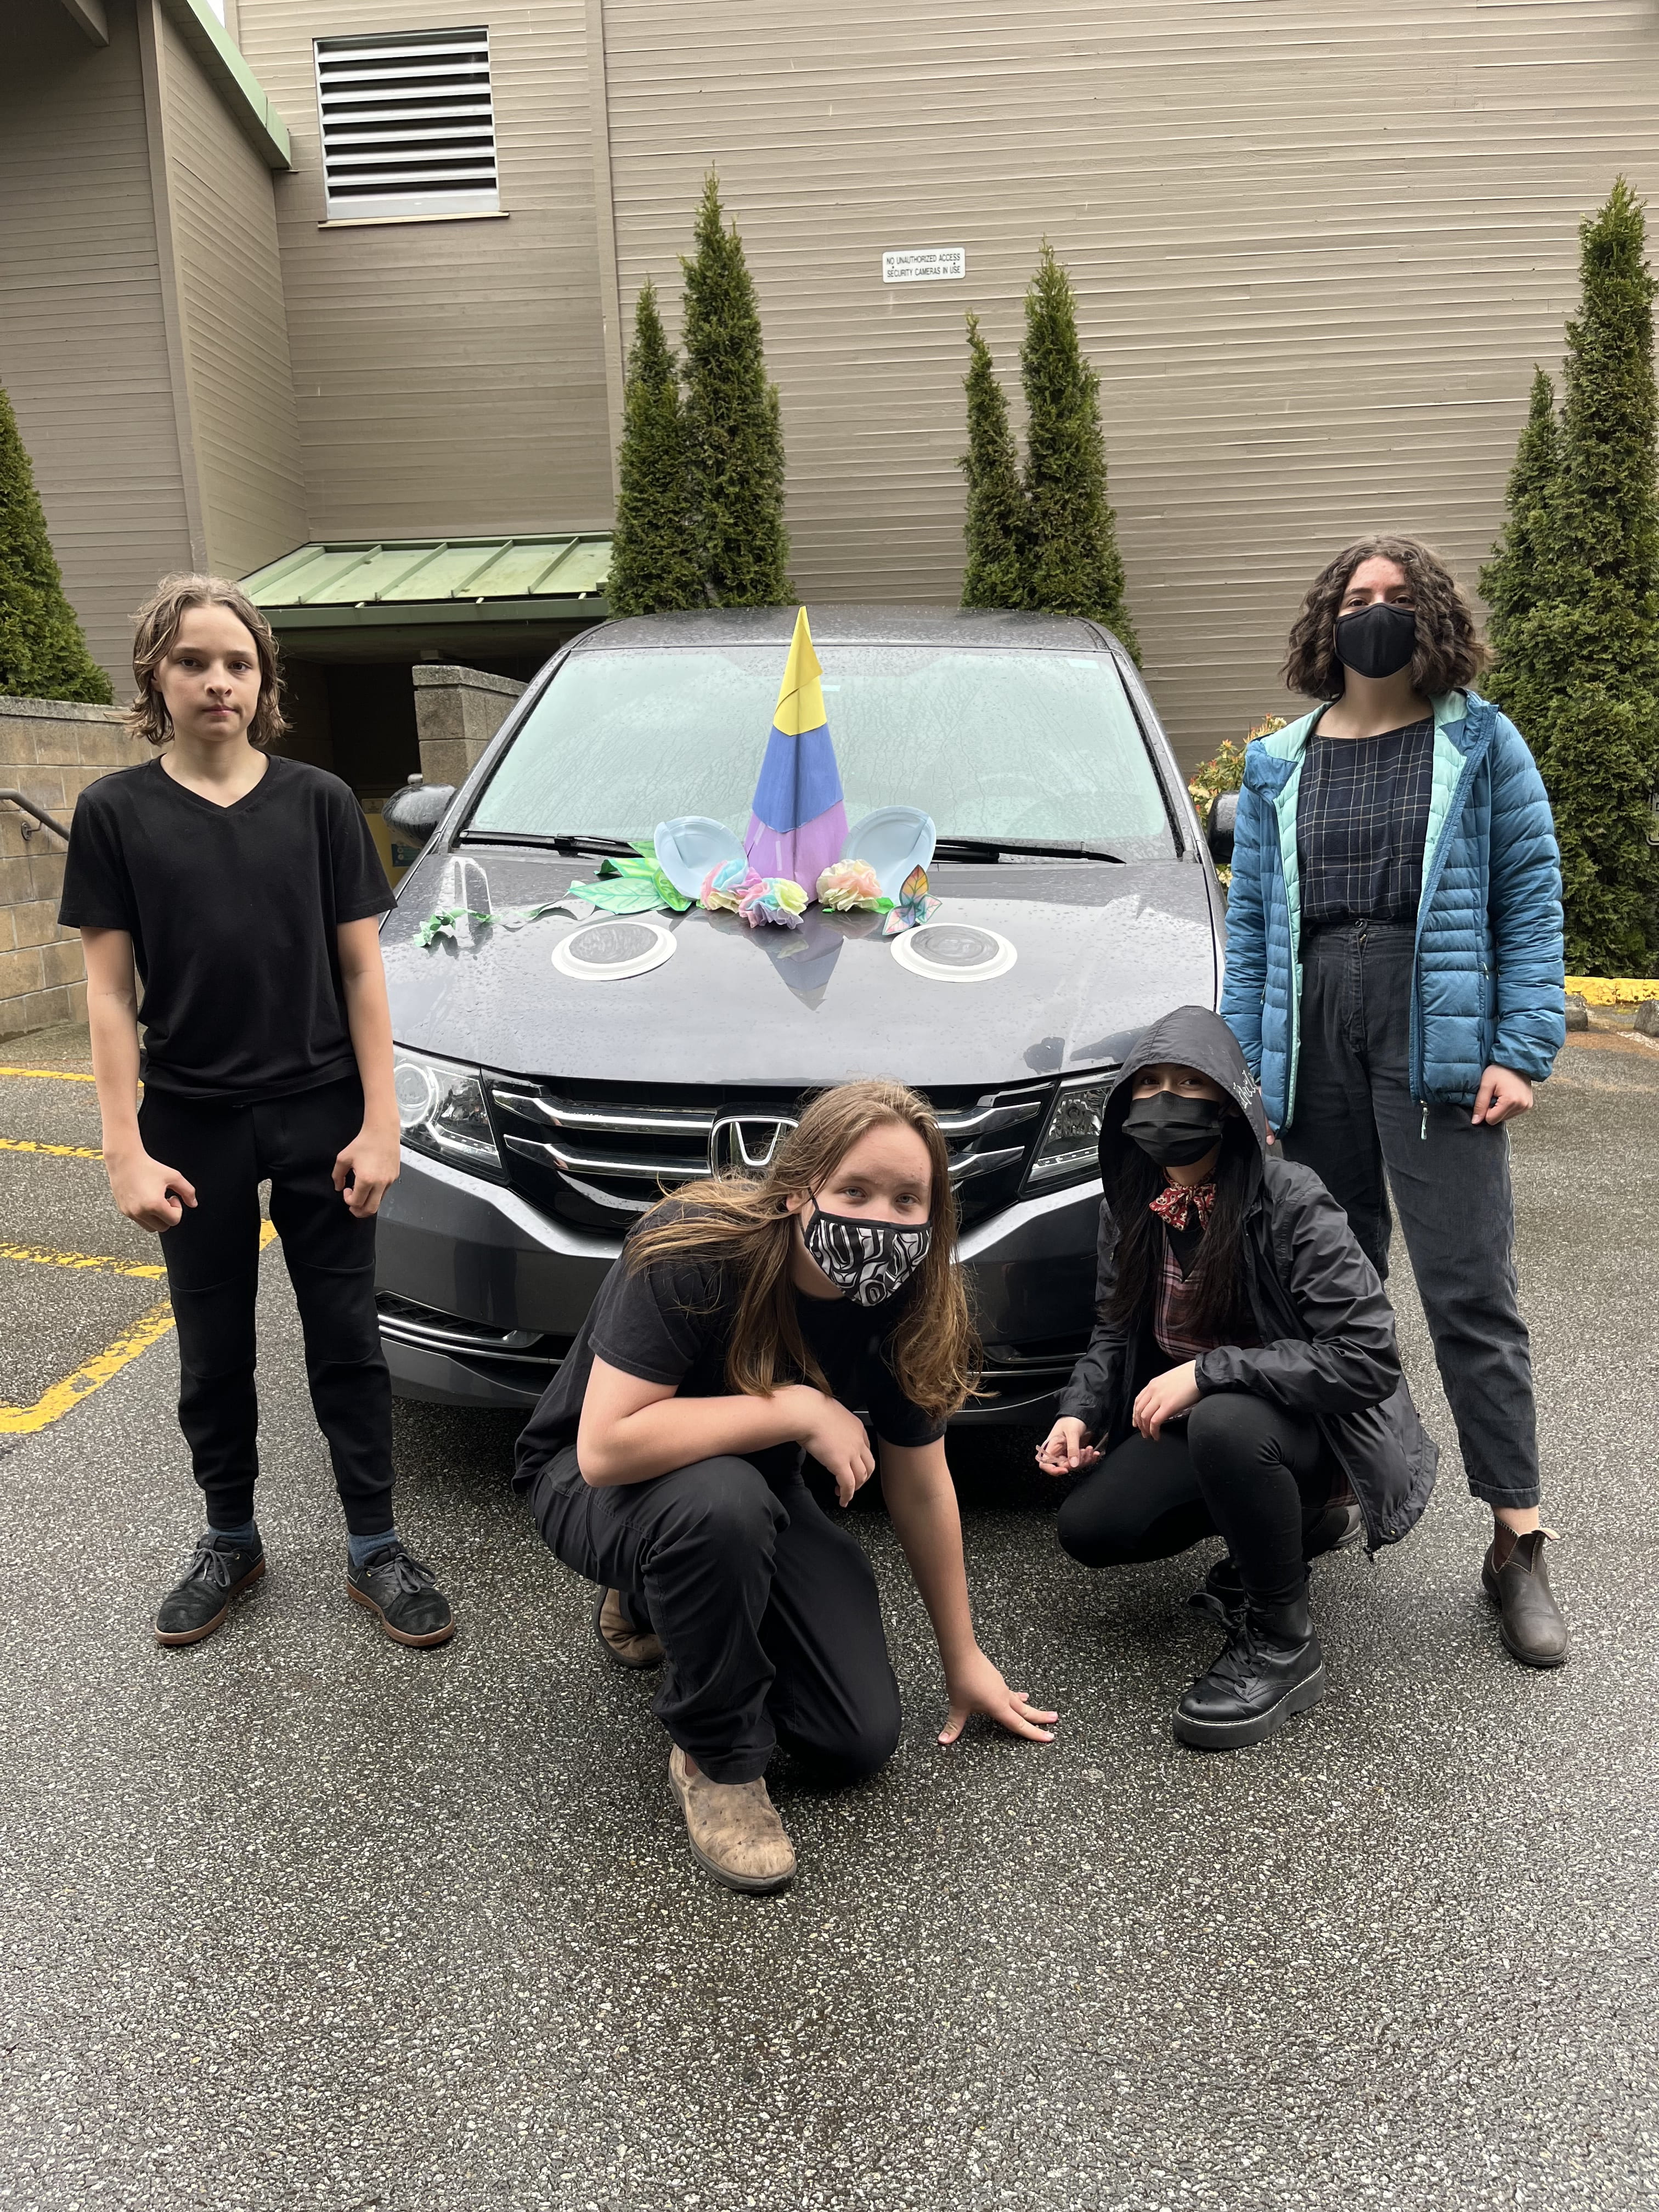
P.S. this year DI had a special challenge where you decorate your car. Here is that:

P.P.S. We won first in the team challenge!

Rube Goldberg was a cool guy.

in the latest Scimatics project we created Rube Goldberg machines to represent the scientific method. The scientific method consists of 6 steps: observation, question, hypothesis, analysis, conclusion. So, without further ado, here is the post.

I wasn’t here for the first couple days of this project, but as always, we started off with a mind map of what we knew already and questions we had. The next step was to perform some experiments on electricity.

After this we did some workbooks and a khan academy quiz that helped me understand how electricity works in a circuit. Then, we created individual diagrams of what our Rube Goldberg machine could look like. Here is mine:

First draft blueprint

Then, my group of Colton, Cale, and Max got to work on our final blueprint, which is a scale drawing of our machine, a digital drawing, and circuit diagrams and calculations. We also built our machine. Here is the final video:

And the final circuit and machine diagrams:

Final blueprint
Circuit Diagram

And for the revised mind map containing all my new knowledge:

Now, for the curricular competencies:

Questioning and Predicting: Demonstrate a sustained intellectual curiosity about a scientific topic or problem of personal interest

All class time is used efficiently for learning without distractions

I think that I used all my class time very well this project, seeing as I was away for most of it and still learned so much and got everything done

Reasoning and Analyzing: Estimate reasonably

Final blueprint is complete and accurate. Contains grid scale. All measurements are labeled with a high degree of accuracy. All lines are easily distinguished

My team’s final blueprint does contain a grid scale, measurements, and is very accurate

Planning and conducting: Select and use appropriate equipment, including digital technologies, to systematically and accurately collect and record data

Hand built series and parallel circuits are used to good effect with efficiency in your metaphor machine. Accurate circuit diagrams are included in the final blueprint. Diagrams use proper symbols. Diagrams are neat and easy to understand. Measurements of current, voltage and resistance are included

There is one series circuit in our machine, the one that lights up the question mark, and all the circuits combine make one large parallel circuit. Their are accurate diagrams of alt eh electronics in our machine in the final blueprint, accompanied by voltage, current, and resistance measurements

Scientific Communication: Formulate physical or mental models to describe a phenomenon

A video is recorded of the complete operation of the machine and voice overs are added which explain the sequence of the scientific method as the machine progresses.

I think that our final video is emerging, because the voiceovers do not sync up, and they do not explain what is happening very well. Also, the video only utilizes one of four videos of the machine working, it much less immersive.

Thanks for reading my post! Once again, thanks to my group for helping me in this project! This project was probably my favourite Scimatics project this year, so I hope to see more like it in the future. See you in the next one.

A Project about Poetry

The latest PLP project was all about poetry. I learned about myself, poetry, and what made the me right now. So, without further ado, here is the post.

We started this project with a cool entry event were we put together pieces of a chopped up poem and answered questions about the poem with it groups. From the very start, we knew we would be making a book of poetry, and the first assignment was to create 2 poems: a simile poem, and a metaphor poem.

The driving question for this project was “How might I construct text that shows who I am right now?” The answer to this question is almost anything! Poetry, art, writing, photography, drawing and creating all are forms of self expression that can help anyone show or learn who they are.

On the second day back, we learned about two concepts: juxtaposition, which is basically just surprising readers with two contrasting things, and comprehending poetry, in order to understand the message of the poem. Each day we got assign one or two new poems. That day, they were a found poem: creating a poem out of previously found material, and three haikus, which are poems were the lineage 5 syllables long, 7 long, then back down to 5.

On day three, not much happened we were assigned a new poem: an imagery poem. This poem is supposed to vividly describe one image.

On day 4 we were assigned a Sunday poem, a poem about the sounds of your worldview,and in class we practiced making silly sounds. (It sounds immature, I know) we were also tasked with starting to put our poems into out book.

In the last two days of this project, we were assigned three poems: an experience poem that describes an experience that shaped your worldview, a self portrait poem that describe who you are now, and a personification poem that describes what worldview is using personification. The self portrait poem can also be used to answer the driving question. And, on top of all that, we had to create and record meaning statements for all our poems and make complementary texts that go next to our poem.

After staying up very late for many days, I completed my book (which can be found below) and concluded this project. This project seemed shorter than previous ones, so this post is more snappy, but I hope you enjoyed it. Also, I feel like there was not enough time for this project, and I wish there was about 2-3 more classes in it.

Thanks for reading my post! I hope you enjoyed it. See you in the next one.

Revolutions on Trial

Hello, and welcome back to my blog. This post is about the latest project for PLP Humanities, Revolutions on Trial. In this project I learned about the French Revolution, the causes of a revolution, and what determines a successful revolution. So, without further ado, here is the post.

As with all PLP projects, we started with a driving question that we strived to answer in the project. The Driving Question for this project was: How Might we as Legal Teams Determine the Effectiveness and Ineffectiveness of a Revolution? And this is how I found the answer.

The first big activity we did in this project was called Nation X. We created a simulation of a society with very large class divisions. There were 4 groups, each with different right and abilities.this activity lasted two days, and contained many events that reflect actual similar societies. For example, in our simulation there was a large revolution to put our old king back in place, and this revolution split the country in two groups. My full reflection on this experience from my perspective is below.

The New Republic Of Nation X, in my opinion, was a fair and functional society. We had food, farms, wealth, happiness, and entertainment. I think that we achieved this by rooting out the people who would not fit in this society and creating a society so good it doesn’t even need laws. To ensure a fair and functional society, I think that there are three main elements that need to be there: basic needs met (food, water, etc…), some way of preventing people from doing bad things (laws, rules, or just generally good people), and lastly, an economy that produces these two things repeatedly. I think of these three things, the last one is the most important because to ensure the survival of a society, the society needs to be relatively self sufficient. But, both of the nations together are not functional in the end, so I do not think our classroom as a whole accomplished the goal. But, overall, this was a really fun activity, and I think it was also an interesting social experiment.

Another great tool to understand how and why revolutions happen is the crane brinton scale. Crane Brinton was a historian of France, and among other things, he studied multiple revolutions and fund common traits in all of them. Using his observations, he create a diagram that split a revolution into four stages: the incubation stage, the moderate stage, the crisis stage, and the recovery stage. My diagram of his theory is here.

Now that we had a clearer understanding of why revolutions happen, we were ready to start reading a famous story based off of an actual revolution. This story was Animal Farm. Animal Farm is a widely renowned novel with a movie adaptation written by George Orwell, which follows the events of a farm as the animal rise up against their captors and form their own society. We had book group discussions about what we read daily. It was great to see what a revolution is like from the perspectives of the people in it.

While reading the book, we were also assigned to groups of six that would each be studying a revolution. I was assigned the French Revolution. I researched the French Revolution until I fully understood it, and then created a graphic organizer to show my learning, Which I revised once.

The next major step in this project was the Animal Farm written response. This was a three-paragraph writing were we explained the anatomy of the revolution in Animal Farm using Crane Brinton’s theory. We had an hour to write this in class, and I think that I got it done fairly Easily in that time constraint.

My thoughts on the revolution in Animal Farm, using the Crane Brinton theory

Now, we knew what we needed to know and were prepared the start creating the final product of this project. The final product is a courtroom trial were we put the effectiveness of the revolution up to the test. We created affadivats, scripts, props, and a set to perform out trials in front of our parents, friends, colleges, and even some random people. And after all that preparation, this is the final result:

So that conclude today’s post, about the revolutions on trial project. I hope you enjoyed this post, and if you want to check out my group member’s blogs, click any of the links below. Thanks for reading, bye.

Cole D.

Dana P.

Makenna C.

Cooper K.

Carter C.

Correlation Vs. Causation

As of two days ago when writing this, the latest PLP project just ended. I am writing today about that project, the correlation and causation project. in this project, I learned how to identify correlation and causation, and make surveys and show the results. So, without further ado, here is the post.

To kick off this project, I started the same way I usually do: with a mind map. This Mindmap graphs all the existing knowleadge I have and the question I have onto paper (or pixels).

This project was about correlation and causation. Correlation is a statistical term that evaluated the degree at which two or more things are related. Causation is when those things actually cause eachother.

The final product of this project is a presentation featuring survey results on graphs that show correlation and causation. For the next major milestone in this project, me and my partner had to make a plan for our survey. We had some ideas for what our survey could be, and in the end we made this:

After making this, we assembled and wrote the questions into a survey we made using google forms. We sent this form our via Basecamp, Snapchat, and iMessage. We received 40 responses in total, all of which are 13-18 years olds. We put our results onto graphs, and found no correlation with our original plan. But, we didn’t just ask four questions, we asked more so that we could look through the data to find correlations (almost) no matter what. And with that, we found these two correlations:

Correlation 1: Friend height VS. Your height
Correlation 2: Perceived height VS. Actual height

Finally, it was time to start working on our final presentation. We started out with an outline of what our presentation would look like

And after that, we made out final presentation, and nothing to notable happened with this.

And then we presented. The presentation went smoothly, though I think we could’ve improved upon it by making our data more clear.

And for the curricular competencies for this project:

Planning and conducting:Select and use appropriate equipment, including digital technologies, to systematically and accurately collect and record data


Two correlations are found using well crafted survey results. The survey results and correlations are are displayed and explained through presentation software. At least two graphs are analyzed to confirm correlation.

Our presentation clearly showed our survey results, correlations and featured two graphs

Communicating and Representing: Use mathematical vocabulary and language to contribute to mathematical discussions

Verbal and pictorial explanations help the audience to understand the circumstances where both correlation and causation are present, and also where a correlation is falsely associated with causation. A Logical explanation for causation is explored for one case.

We showed our exploration into one of the correlations to prove causation which follows a logical course. We also have verbal and pictorial explanations that help guide the audience to a conclusion.

Applying and Innovating: Contribute to care for self, others, community, and world through individual or collaborative approaches

Good ethics are followed when conducting surveys. All class time is used efficiently for learning without distractions.

I used my time wisely and only missed one deadline this whole project.

Well, thanks for reading my post, and I hope you enjoyed it. Stay tuned for the next one.

My partners Max’s blog

People And The Environment

Hello, and welcome to another post. Today, I am going to be talking about the latest PLP project I have done: people and the environment. The driving question for this project is: “How do people and the environment affect each other” and over the last five weeks, I have sought to answer that question. So, without further ado, here is the post.

The first thing we did was a writing activity about whether most people are protectors or destroyers of nature. For me, I almost immediately knew I thought they are destroyers. This is mine:

The end product of this project is a letter to someone important about an issue. The letter must include possible solutions to that problem, evidence of the problem, and a clear and meaningful call to action, with the intention of creating meaningful change within our province.

Throughout the project we did multiple commonlit activities to help us understand message, meaning, themes, and how to use evidence. Each commonlit consisted of a story, and then questions about the things above.

The first milestone in this project was a letter plan conference, were I pitched the idea for my letter and clarified my plan to make the product. I decided I would write to the premier of BC, Mr. John Horgan about a law that could help stop BC’s extremely large amount of forest fires. BC accounts for over three quarters of Canada’s wildfires, so I wanted to try and help. This conference went well and provided lots of much needed clarification.

The second milestone was just an accumulation of all the commonlits: hey, come on out, quiet town, the sea also rises, and Lee Sherman and the toxic bayou. And for milestone three, we were to choose one of these stories, and connect the theme of the story to the theme of our letter in a three paragraph write up. before writing, I wrote an outline for my multi paragraph writing to sort my thoughts.

And, in the 60 minutes of class time we had to write the paragraph, this is what I came up with:

If I were to do it again, I would try to connect the two themes more strongly, and try to cut down the first paragraph a ton. But, all in all, I think I did a pretty good job.

Now, just like in the last project, the milestones were kind of shuffled, so this whole time I was also writing drafts for my final letter. I wrote five drafts of my letter, which are featured below.

So, once my final letter was finished, I addressed it, put it in an envelope, and sent it off.

Thanks for reading my post! I learned a ton in this project, and will in the next one too, so stay tuned. See you in the next post, bye.

Epidemic Exponents!

Hello, and welcome. I am back to school, and starting this year in scimatics with exponents! In the first scimatics project this year, Game of Exponent Laws, I learned how to evaluate exponents, exponent laws, and more. So without further ado, here is the post.

To kick of the project, we did a quick activity were we made up games that used one and two dice. We got into groups of four, and started working. And here are the rules we came up with:

Rollie poll-E

Assemble all the players in a circle. Decide who will roll first, and have them roll the die. If their roll is a 4, 5, or 6, add the roll to their point tally. If their roll is a 1, or 3, subtract their roll from their point tally. Point tallies cannot drop below zero, and if they reach twenty, that person wins. If they roll a 2, they get to roll again and multiply that roll by two and add it to their point tally.

Rollie poll-E 2.0

To win, gain 5 points. You gain a point when you correctly answer a question faster than your opponent(s). Choose someone to roll each round, and have them roll the two dice. Once the dice have settled, every player starts solving the math problem. If the dice are both even, devide the greater roll by the smaller one. If the dice are both odd, multiply them. If the dice are odd and even, add them together. Once you figure out the answer, say it aloud, and if you are the first to solve the problem, you get a point. Decimal points are allowed for answers. If the roll has a 1 then subtract 1 from the other roll

(Special thanks to Jocelyn for thinking of the names)

So, as common with scimatics projects, we all were supposed to make a mind map that’s outlines what we already know and what questions we have.

Project Start Mindmap

Now, in this project, the milestones were not a linear process, but in a slightly erratic way, with the milestones not coming in numerical order. So, for the sake of this post, I will tell you about the events of this project in chronological order.

After these first assignments, me and my partner started brainstorming Ideas for our game. Our first milestone was milestone four (confusing). For this project, everybody was given a partner, and together you and your partner would make a game that uses exponents as a central mechanic. So, eventually, me and Aliciah decided to make a game about viruses. Our idea was quite similar to pandemic: contagion, which is a game were each player is a virus trying to exterminate humanity. Our first draft of our rules are here.

Throughout the next week, we updated our game rules and did some exponent practice, and eventually landed on this set of rules:

After making these final game rules, it was time to make our game board and pieces.

Final Game Board!

And, of course, there were curricular competencies for this project, which are listed below.

Applying and innovating: Contribute to care for self, others, community, and world through personal or collaborative approaches.

All class time is used efficiently for learning without distractions. All group members contribute equally.

I used my class time well, and I think that is reflected in the quality of my work. My partner and I shared equal part in the workload for this project.

Reasoning and Analyzing: Use logic and patterns to solve puzzles and play games

A clear and simple points system and win conditions for the game are carefully designed.

Points system is clearly represented by physical game pieces, and finding out who wins a game is easy and concise.

Communicating and Representing: Represent mathematical ideas in concrete, pictorial, and symbolic forms

A set of clear, complete, interesting and personalized instructions are created for how each player takes their turn. Examples are included. The game design uses at least 4 different exponent laws and using these laws is integrated into each player’s turn.

Our game features game rules completely written from scratch, with our own ideas and examples of gameplay and game pieces. There are over four exponent laws included in our rules.

And that concludes my blog post for today! Thanks for reading this far, and if you want to check out my partner Alicah’s blog, click here.

See you in the next post, bye.

Don’t Eat Rat Feces!

Today, I am writing a summative post about my latest, and last project of the year. This project is called Comic Cells. I learned a ton from this project, from what subsequent endocytosis is to why you shouldn’t eat rat poo. So, without further ado, here is the post.

As with all scimatics projects, we started off the project with a mind map of existing knowledge, question, sources, and anything else about the topic. Here is mine:

Project Start Mind Map

For the second milestone of the project, I created a wanted poster for a disease containing the date of discovery, how it affects cells, it’s mortality rate, and more.

Typhoid Wanted Poster

Then I started working on a storyboard to guide the making of my comic. The storyboard was a very rough guide to the comic, and some parts were not even in the final comic.

Rough Storyboard

Then I started to research a TON of facts about the virus I chose. (Hantavirus) To read more about hantavirus, veiw the sources down below. I learned a ton about cellular processes, and then started drawing pictures for my comic. I am not the best at drawing, so this was a hard task for me. However, I a very proud of the final comic, which is the namesake for this post.

And, as with all projects, there were core competencies I worked towards throughout the project. They are:

1. Questioning and predicting: Demonstrate a sustained curiosity about a scientific topic or problem of personal interest.

All class time is used for learning and creating a comic book story about cellular processes and/or diseases. I think I used almost all of my class time efficiently, but even so I still think I could’ve worked slightly faster in class and had less homework after school. But it worked out in the end, which is good.

2. Scientific communication: communicate ideas, findings, and solutions to problems using scientific language, representations, and digital technologies

Correct vocabulary and accurate diagrams are used. At least 10 interesting science vocabulary words are included in the story. I used more than ten science words in my Story, and I think my diagrams are concise and accurate at what they represent.

Evaluating: Demonstrate an understanding and appreciation of evidence

Cell/bacteria/virus characters interact in a scientific way. Symptoms and logical outcomes of the chosen disease/cellular/ body process are integrated into the story. In my story, the reaction to the virus is realistic to real-life cases, and the outcomes are on the probable side.

Sources:

Source 1

Source 2

Source 3

Source 4

Source 5

Source 6

Source 7

Thanks for making it this far. If you liked this post, make sure to check my other ones here. See you in the next post! Bye.

Atoms

As you can probably tell from the title, this project was one about atoms (and molecules, Kenetic energy, etc…). We spent about three weeks learning, coding and thinking to answer the driving question for this project: how can the behaviour of matter be explained by the Kinetic Molecular theory and the Atomic theory? So, without further ado, here is the post.

We started this project with a mind map and an experiment/magic trick. We wrote the mind map about what we already knew about matter, and then all of our questions about it.

Project start mind map

For the demonstration of atomic and molecular theory, the teacher performed a trick using a sealed bottle filled with water and an eyedropper.

The trick works by utilizing pressure. When the bottle is not squeezed, it looks like this:

Eyedropper at the top

But when the bottle is squeezed, the pressure increases, forcing the eyedropper down, and if you are subtle, it looks as if you magically made the eyedropper go down.

Squeezed bottle with the eyedropper down

One really cool activity was called the gemstone identification challenge. The whole class partnered up to measure the volume, weight, and then calculate the density of a few stones. The class average density was 3.74 grams per millemeter, and the closest density to that was that of colourless topaz, so we confirmed that the stones were colourless topaz.

Gemstone ID sheet

For milestone 2, we created accurate models for our coded project. In order to make our simulations or games follow this competency: Several different atoms/molecules, different states of matter, and particle motion are represented in the finished product. A historical model of the atom is chosen and implemented, we created some sort of model and text.

In order to create realistic and functioning models of atoms, molecules, and in my case quarks, I worked on three slides of information and graphics. It took three other versions to create to the one shown below.

The next week was mostly spent learning more about matter and coding or refining our scratch projects. Then we did milestone four, which was a coding plan for the rest of the project. This was my milestone four coding plan:

Features:
Press space to show Bohr models
Press M to mute music
Press N to unmute music
Press Q to create more clones
Press 1-3 to change molecule type
Gravity that can be turned on and off
Click the reset button to reset the simulation
Use the temperature slider to change how fast the particles move.
Setting the temperature to zero will stop the particles from moving, other than gravity acting on them.
You can create different states of matter by adjusting the temperature and gravity.
you can adjust how much gravity there is.
You can move between subatomic particle models, Bohr models, and no models by pressing space bar twice This kinetic molecular theory is included in the simulation when the particles move. They follow the Kinetic molecular theory.

After creating a plan, I continued coding my scratch project until it was completely done and polished. If you want to check out my simulator, click here. After all was said and done, I created a summative mind map of the project, which helped round of the end of the project.

As with all projects, there were curricular competencies which you can see below:

Questioning and Predicting: Demonstrate a sustained curiosity about a scientific topic or problem of personal interest.

All class time is used efficiently for learning without distractions. I used all my class time efficiently, and I am very proud of my final product.

Scientific Communication: communicate ideas, findings, and solutions to problems using scientific language, representations, and digital technologies.

Several different atoms/ molecules, different states of matter, and particle motion are represented in the finished product. A historical model of the atom is chosen and implemented. I have three different molecule designs: H2O (water), carbon dioxide (CO2), and ozone (O3). I also have three Bohr models of the elements: carbon, hydrogen, and oxygen, And finally two subatomic models of protons and neutrons.

Reasoning and Analyzing: Use logic and patterns (including coding) to solve puzzles and play games.

An interactive Scratch coded matter simulator or game is created with logical conditions and functional user controls. I created a simulator with four variables that the player/user can change, and extra aesthetic changes as well. The user can change limits all the variables, and the layout is logical and easy to use.

Thanks for reading my post! I had a great time doing this project, and i am sure to do more, so stay tuned .Even though I have featured it already, just in case, here is the link to my scratch matter simulator. Thanks to my friend Noah for all the coding help and feedback. If you want to check out his blog, click here. See you in the next post!

Exploring European Exploration

Welcome to another summative post. Today, I am going to talk about our latest project on European Exploration. This was a three weeks long, and consists of five milestones. So, without further ado, here is the post.

The driving question for this project was: What Did European Settlement Mean For Everyone Involved? To answer this question, there are two thing you need to know first: what is European settlement, and who was involved, and this post is documenting how I found the answer to this.

We kicked off this project with our first milestone: a stream-of-consciousness writing about European Settlement. This was the first assignment of this project.

We did some other activities to build our knowledge, and then did milestone two, a sheet were we used evidence to rank events by significance on a chart. This is what it looked like:

Continuity and Change sheet

Throughout this project, me and my partner have been writing almost everything in one shared document. We have written scripts, notes, photos, content, and sources.

After we finished researching and creating our facts and graphics, we handed the rough infographic in as milestone three.

Milestone 3

Over time, me and Cale refined our infographic, and created six different version before the final product was created.

We then created a script, description, title, QR code, and Keynote magic move for our YouTube video.

Video Script
YouTube Information
QR Code To Video

Using all of this, we created the video which the QR code on the infographic leads to. You can find this video here.

And finally, we worked on putting all 26 infographics up around the school. We decided on were to put the infographics and which ones should go together, then put them up!

And that brings us to now, where I can answer the driving question: What Did European Settlement Mean For Everyone Involved? Well, the answer is complicated, because of how broad of an event it was. In my infographic, I focus on one aspect of it: alliance and trade. European settlement affected the First Nations, British, and French. Even today, and I’m sure for long afterward, trading will remain a constant. But what resources that are being traded, how they are traded, and the people trading them will always be changing. Alliances are crucial to humanity, and we are able to accomplish much more when we ally together. European Settlement gave new resources, trading routes, and opportunities for alliance to everyone involved, and that completely changed history for long after.

Thanks for reading my post! If you want to check out my partner’s experience with “The More Things Change” project, click here. Anyways, thanks for reading my blog and see you in the next post.