Contents
We just switched to our new classes which means that I am now in scimatics. The project we did was called Fractions Of Your Time. This project was my first project in scimatics and I found it really fun and interesting.
What Was This Project❓
If you have read some of my other project review posts you would know that each project in PLP has a driving question that we try to answer. This projects driving question was “What fraction of our time is screen time?”. This blog post is a summative post which means I am going to go through and explain what this project included, how we answered the driving question, and some of the curricular competencies.
What Did This Project Include 🗂
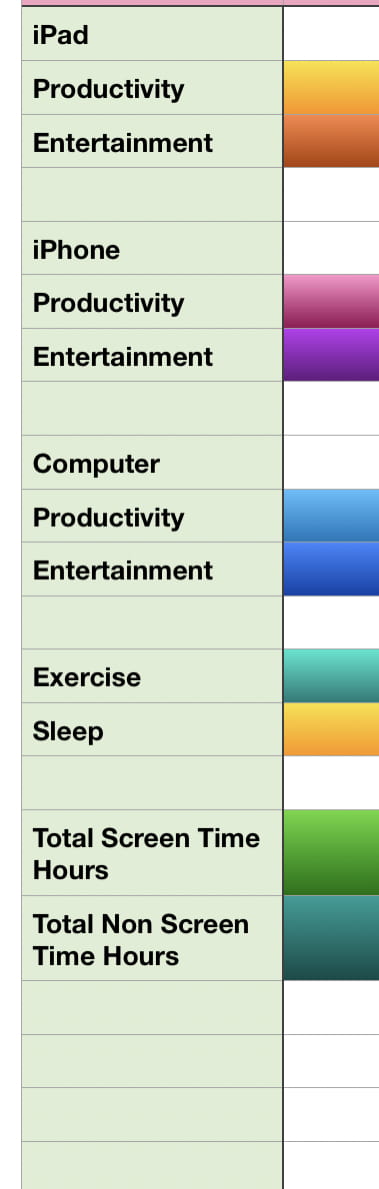
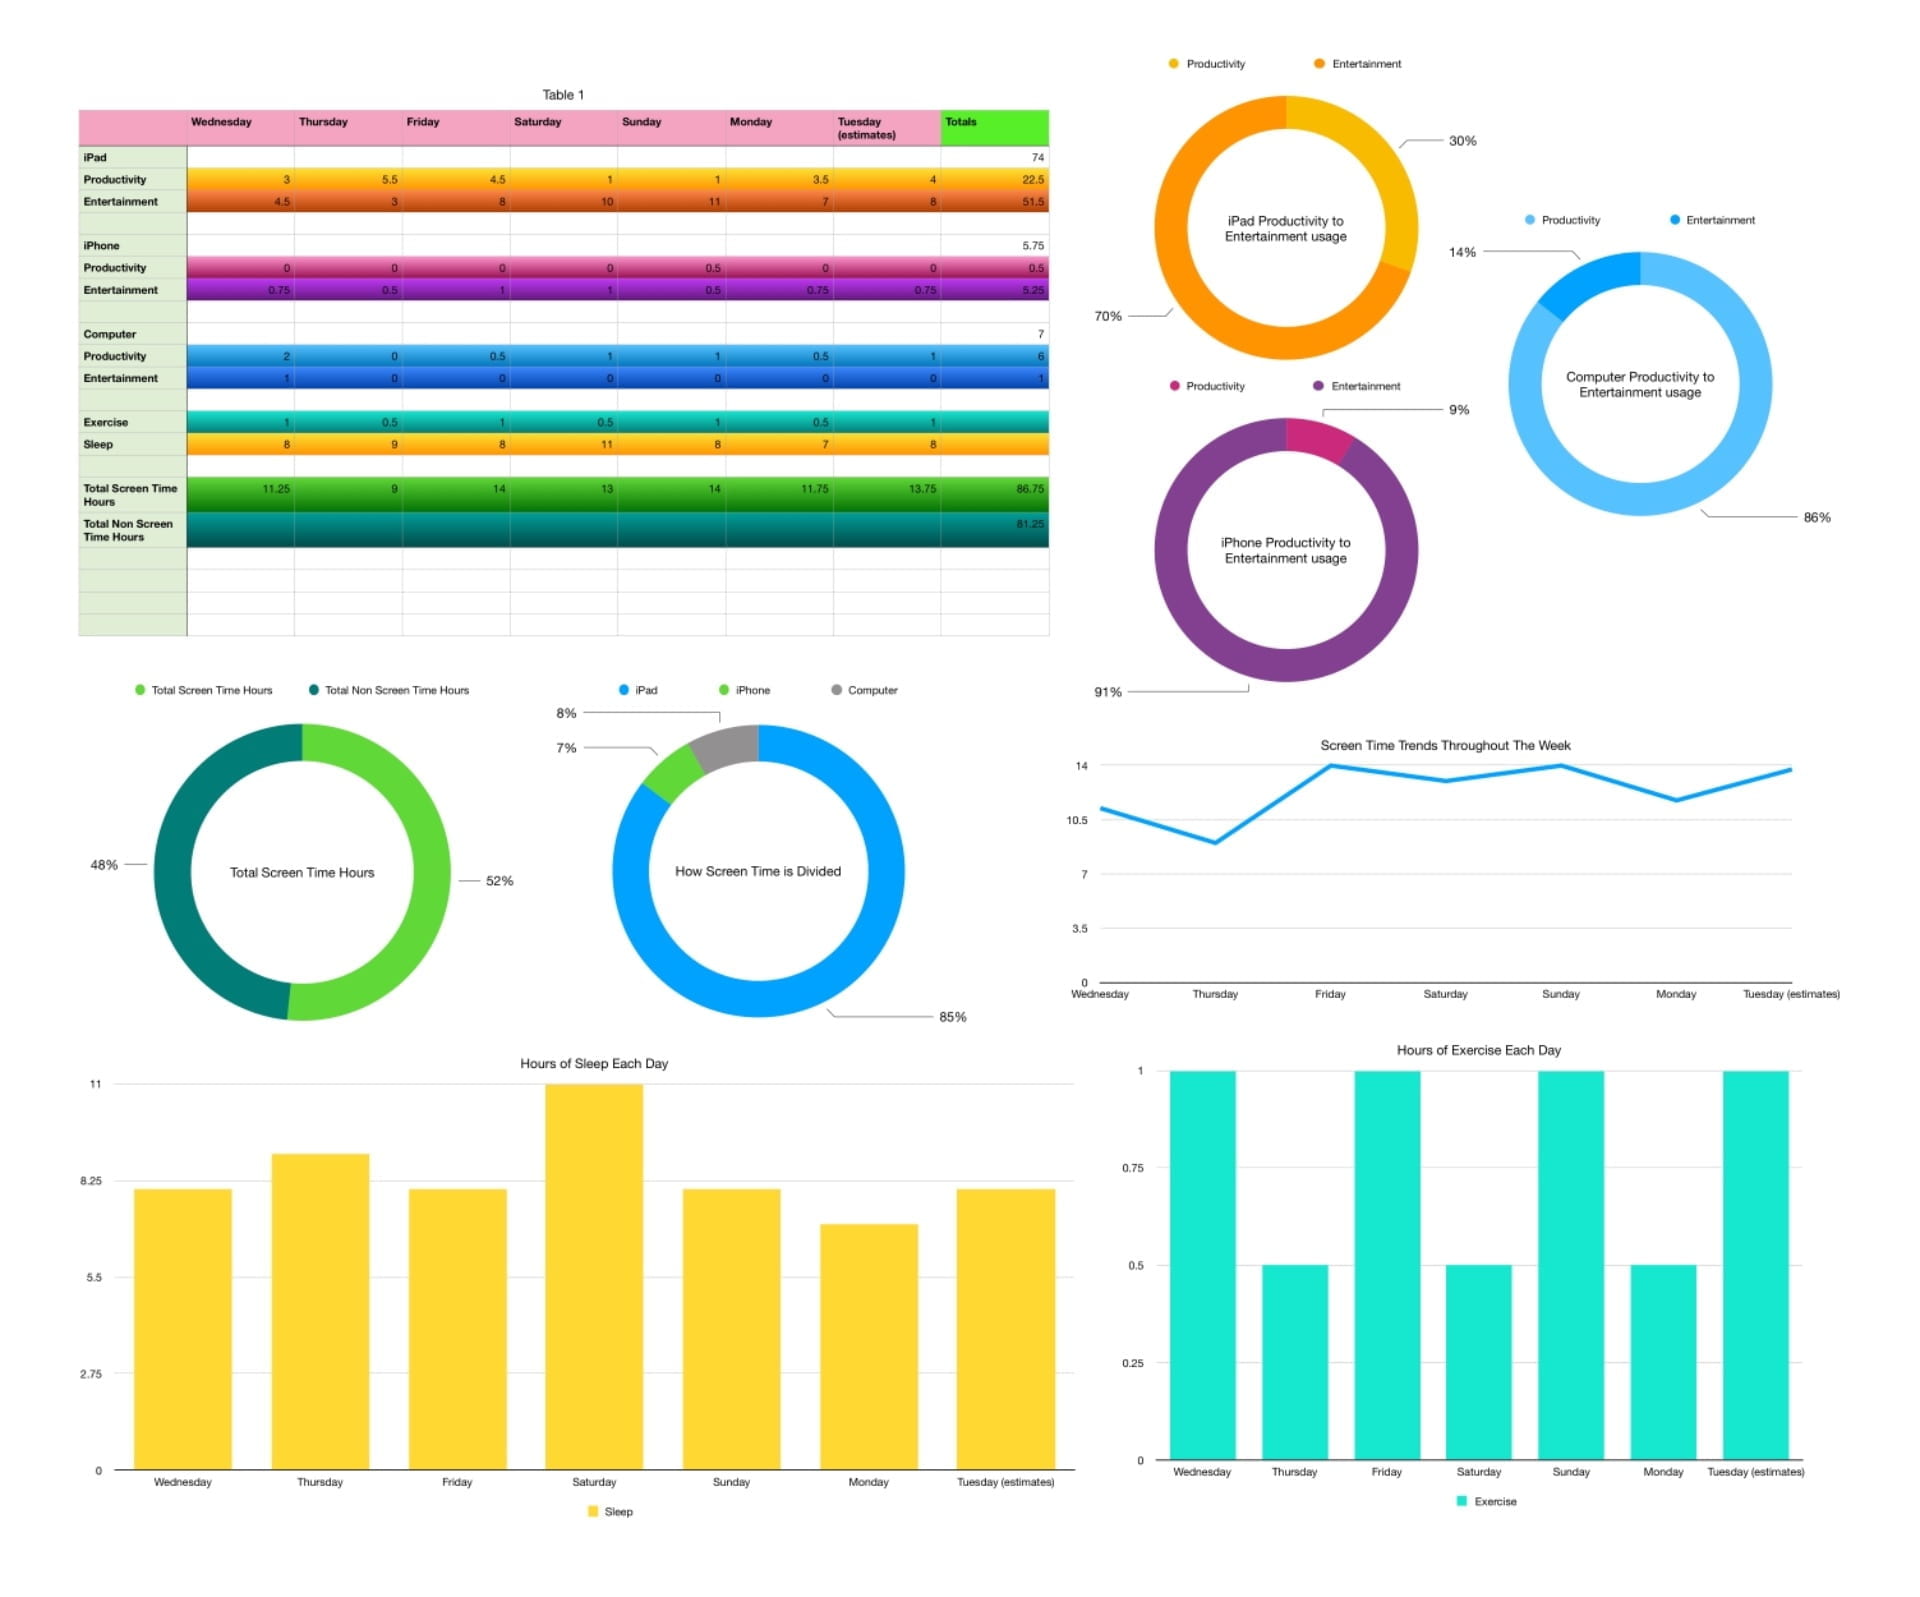
To answer this projects driving question we kept track of how much time we spent on screens for one week and put them into a chart. In milestone 4 we started making the charts. We had to first choose the devices we wanted to track along with some non screen related things to track. I chose to track my iPad, iPhone, and computer along with my exercise and sleep.
Competencies
Understanding and solving – I showed my knowledge of this competency when I made the chart with all the numbers of my screen time, sleep, exercise and all the different graphs I added in as well to show the data. This helped to visualize the numbers to explore the concepts.
Communicating and representing – I showed my knowledge of this competency with all of the charts I used to display my data. I used some different types of charts to visually show the numbers. The charts I used were a donut chart, a line chart, and a graph chart. I used the donut charts to show percentages of how much of my time was taken up by one thing. I used the line chart to show my screen time throughout the week and I used graph charts to show how much sleep and exercise I got each day. I also chose to colour code the lines on the table to correspond with a chart.
Applying and innovating – I showed my knowledge of this competency through keeping track of my screen time. This helped me to be more aware and while I will probably not change how much time I spend on screens I do think that it is important to be aware of these things.
My screen time tracker
Final Thoughts 🧠
So what did I learn from this project? I learned a lot throughout the process of completing this project. I learned how to use formulas in numbers, use charts to display data from tables, and I also learned more about how my time is divided and now know more accurately how I spend my time and how long I spend on different things.
So did we answer the driving question of this project? Obviously we did or I wouldn’t be writing this post. I kept track of my screen time throughout the week allowing me to see what fraction of my time was spent on screens, which was half of my time, answering the driving question “What fraction of our time is screen time?”. Thank you for reading another one of my summative project posts. I would suggest reading some of my other project posts for The Medium Is The Message and My User Manual.

Be First to Comment