Throughout our latest Scimatics project, our PLP 9 class has studied different aspects of surveys, and the difference between correlation and causation. A majority of my fellow classmates worked in pairs for this task, though I ended up working independently.
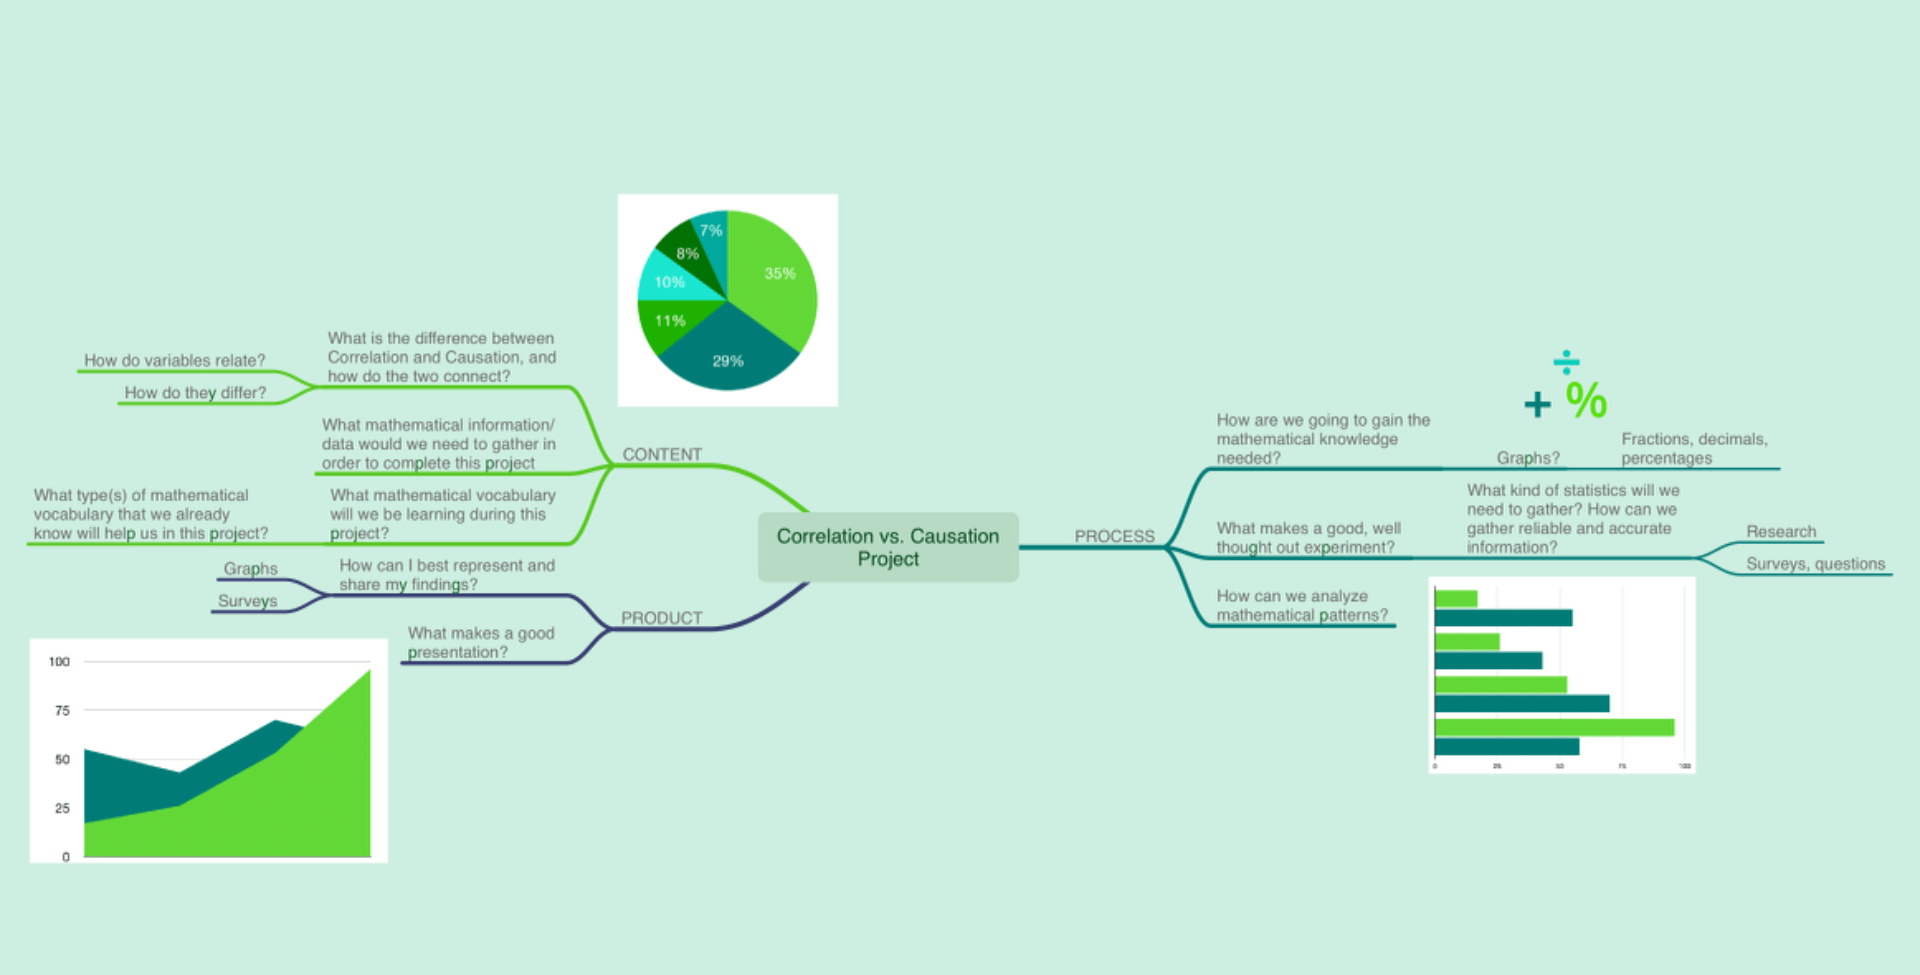
Project Start Mind Map
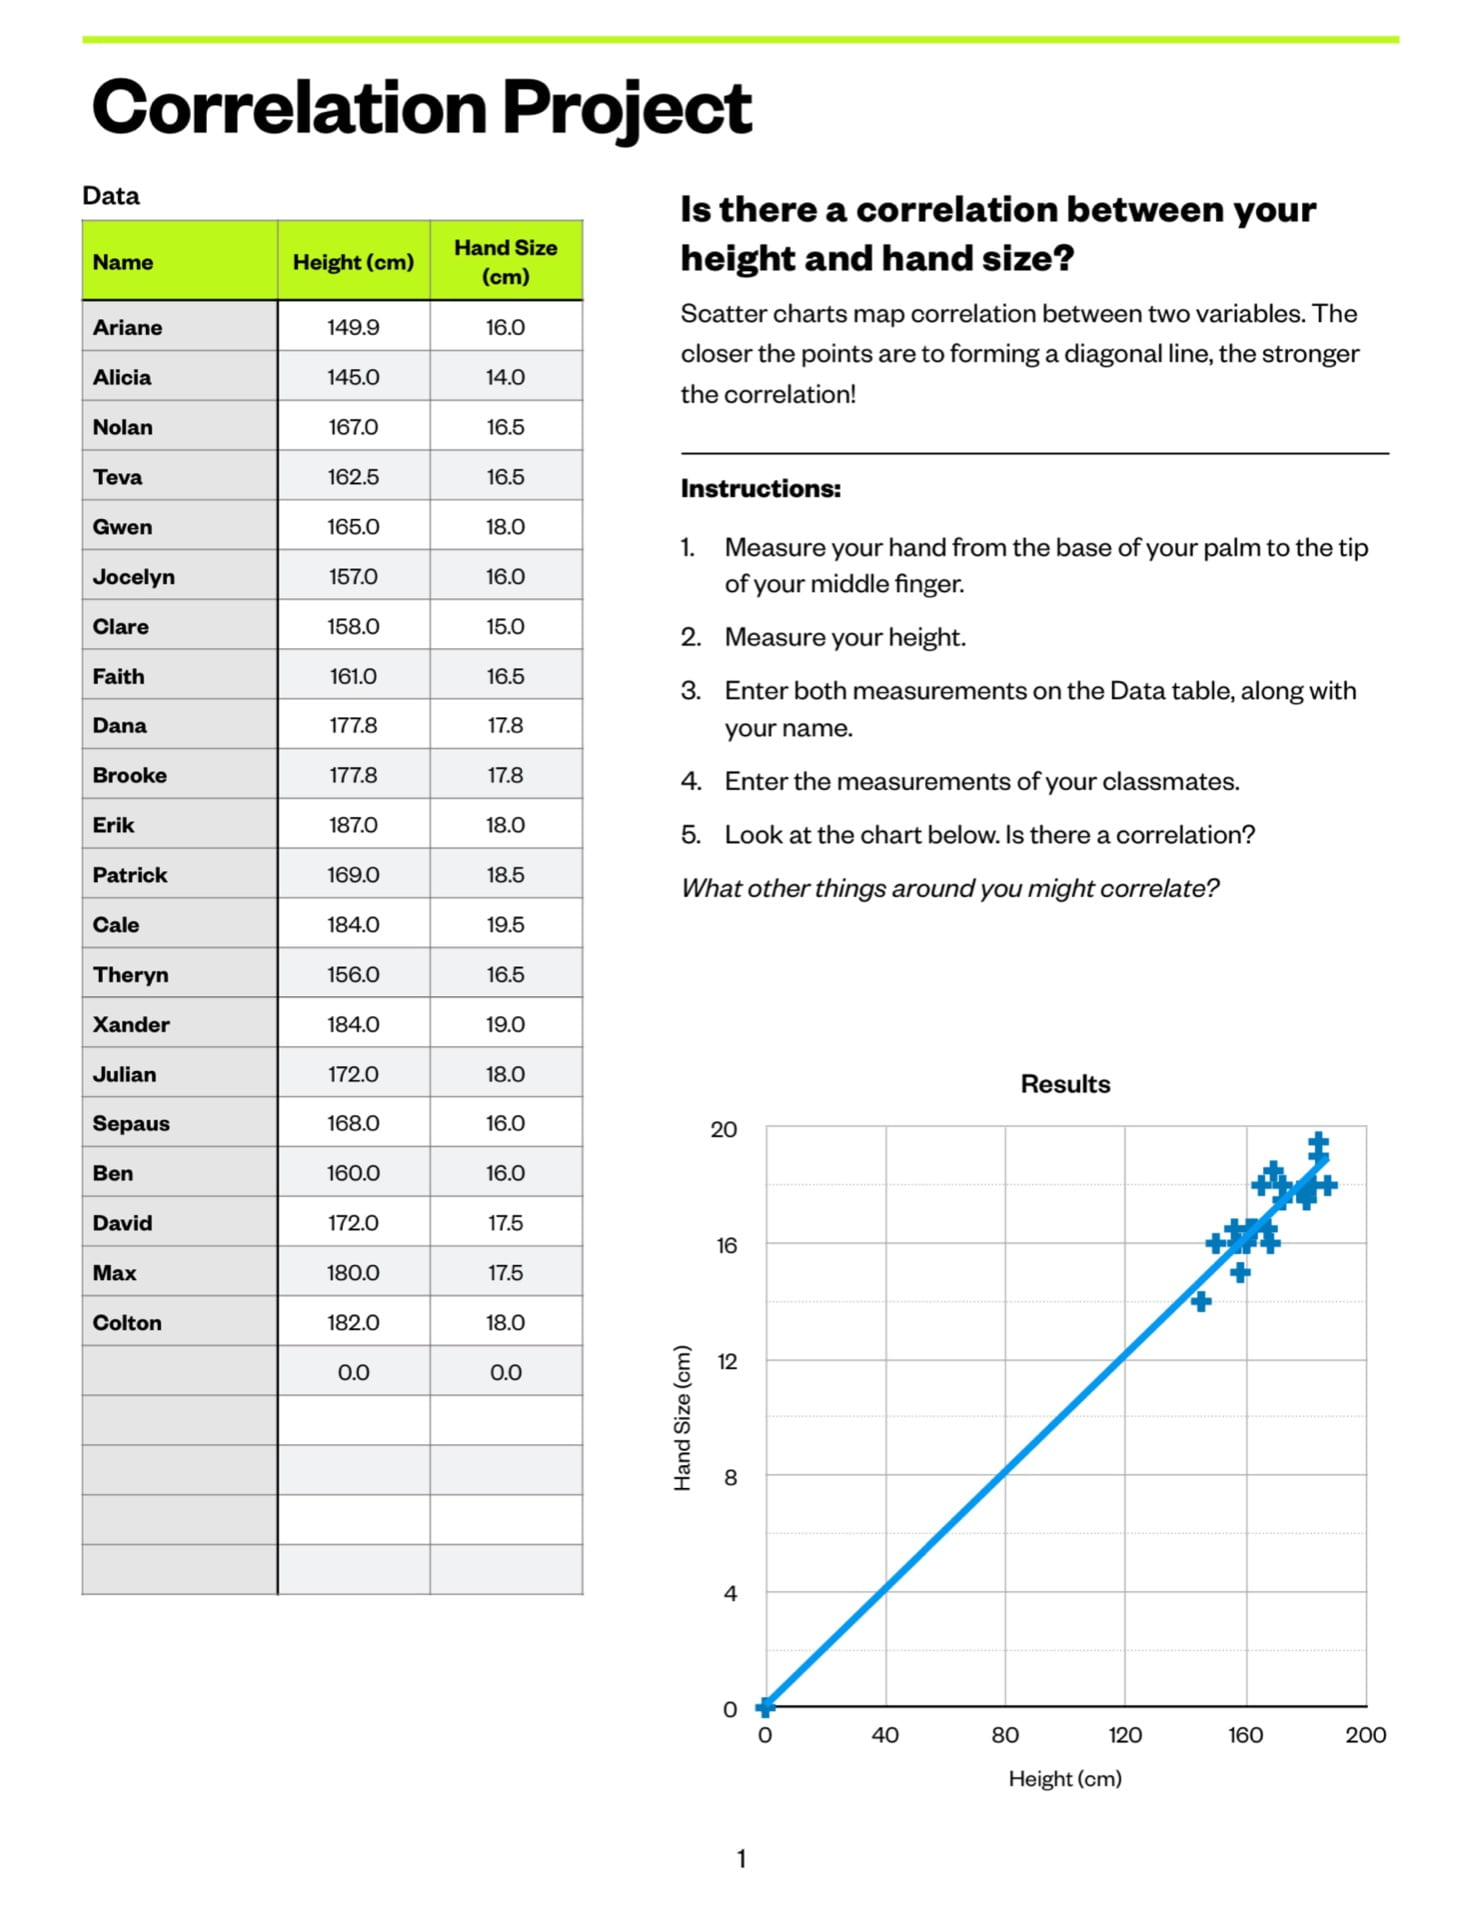 In order to gain an understanding of correlations, we first surveyed our classmates on their height and hand size. Our goal was to determine whether there was a correlation between the two aforementioned sets of data, which we ultimately determined there was. This was a strong positive correlation, and a possible causation could have been a third factor, such as bone structure which is in itself determined by various other factors.
After conducting further research on different types of surveys as well as correlations, our class finally each made a survey plan of our own. Although I had mapped out my survey and done well on my plan, I ultimately ended up revising my survey quite a few times. This was mainly due to the fact most participants of my survey found many questions confusing to answer, and approached me to “follow up” on them. As an introvert, this was a very scary experience, however I did manage to improve on my survey after receiving feedback… which helped me gather the necessary data to move forward.
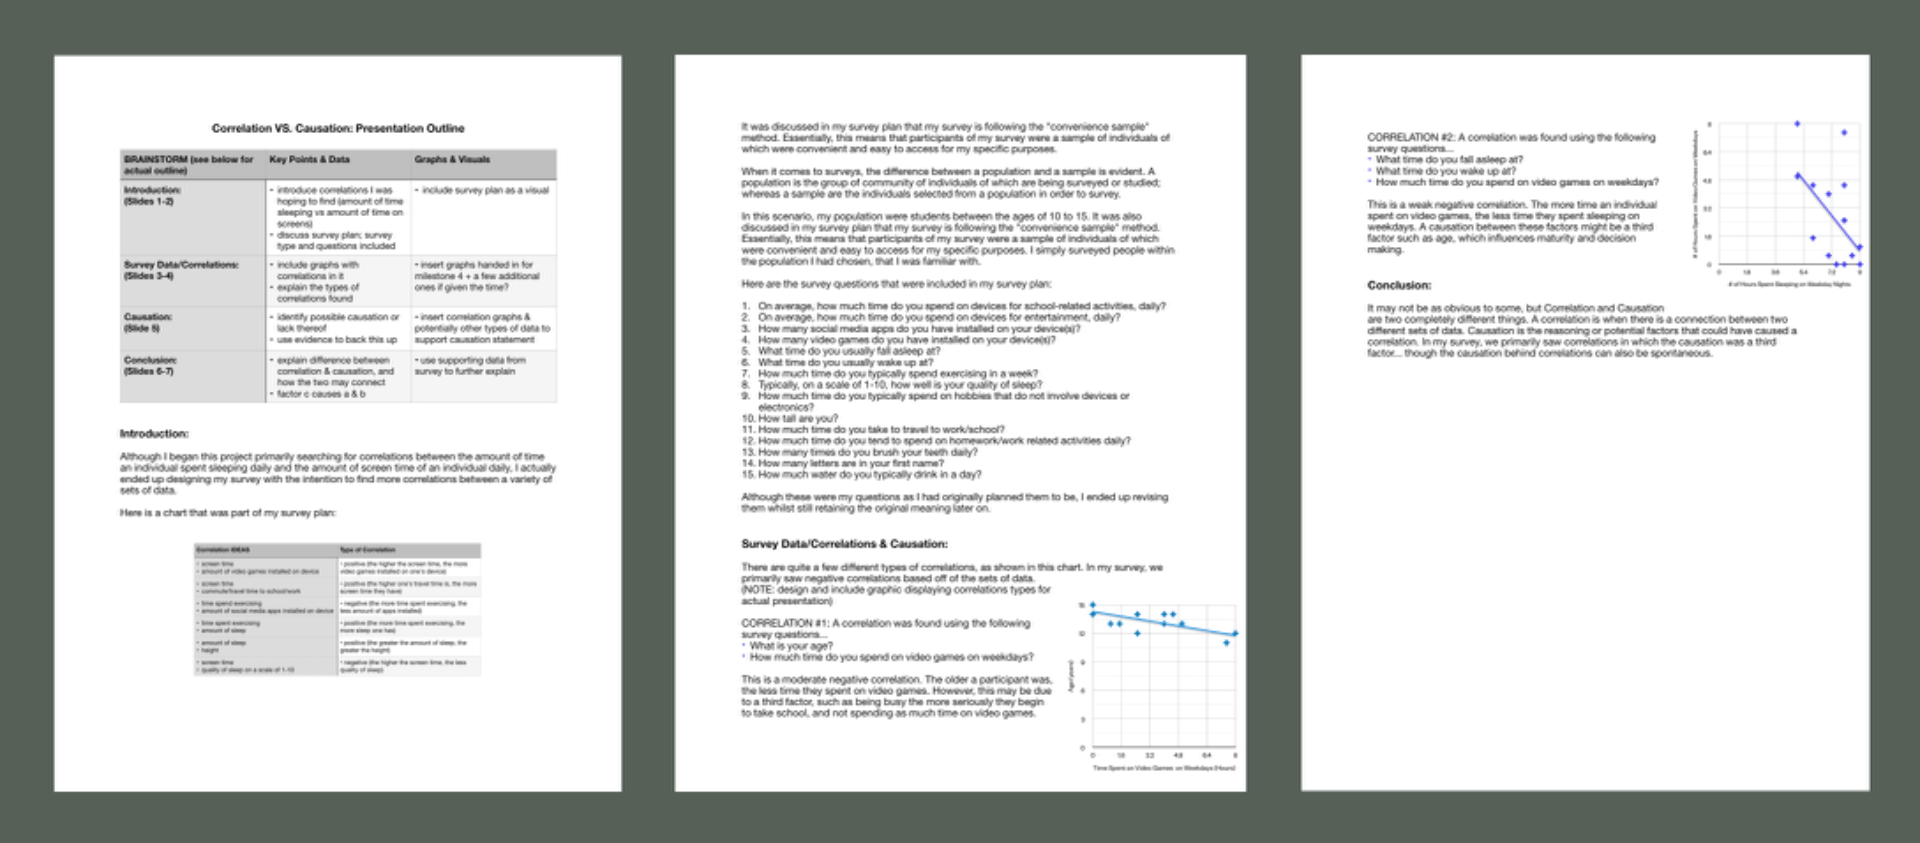
Once I had surveyed as many survey participants as I could, I then sorted through my data and searched for correlations. Here are two correlations I found.


In order to determine how I can best present and record my findings, I then made a presentation outline.
Presentation Outline
Then, I moved onto my final presentation.


Curricular Competencies:
- Planning and conducting: Select and use appropriate equipment, including digital technologies to systematically and accurately collect and record data.
I believe I completed this competency to standards. My final presentation had four graphs based off varying sets of data. Each of these correlation graphs were shown and explained the type of correlation, the survey questions used to find said correlation, and a possible causation (or lack of).
- Communicating and Representing: Use mathematical vocabulary and language to contribute to mathematical discussions.
I made use of mathematical terms in the explanations behind my correlations. These explanations included logical reasoning behind correlations and their possible causations, as well as a case where correlation is not associated with causation.
- Applying and Innovating: Contribute to care for self, others, community, and world through individual or collaborative approaches.
I did my best to follow good ethics throughout the undergoing of my survey, though I did receive some feedback that some survey participants felt uncomfortable answering certain questions, and I further revised my survey based off that feedback. However, in the future, I will make sure to be more considerate when surveying others. Individually, I remained on task throughout class and used class time productively.
In response to the driving question, I believe a fair and reliable survey entails following good survey ethics, and surveying individuals across a specific population. Although I was unable to survey as many students as I had wished I could have, I do feel that I surveyed enough students to provide myself with detailed and accurate data, seeing as it ultimately succeeded in providing me with correlations.
Creating surveys and analyzing data isn’t a walk through the park, and can oftentimes feel mundane, especially seeing as the data felt lacking in terms of a specific purpose. However, collecting accurate and valid data does sound like an important skill for the future, therefore I am glad to have experienced this assignment.

Leave a Reply