Linear Labs Artisan Jewelry

Greetings fellow earthlings. Welcome to another scimatics post on this ghastly blog of mine. I am currently writing this in my bedroom where I have been glued to a tissue box and a whole plethora of cold medications in my system. If you didn’t get it already, I’m sick (not covid).

Project Overview

This project was called “Time is Money” but for some reason I’ve been calling it “Time Beith Money” like in an old-English type of flare. Anywho, in this project we were to create a small business selling products or a service and learn about finance though linear relations. I chose to make a small jewelry store through Instagram and sell some cute lil’ accessories to my friends. Now I am no wiz at math but eventually I did catch on to this whole algebra thing and boy is it helpful to know how to do.

Driving Question

How can we predict our finances for the future?

With calculating your expenses (living), startup costs, sale price (income), and time, you can get a pretty accurate estimate of how sustainable your finances are. Using a linear relations equation like where and putting the equation into a graph where the y axis represents profits and the x axis represents hours of work, you can get a visible representation of your financial situation.

Curricular Competencies

Communicating and representing: Represent mathematical ideas in concrete, pictorial, and symbolic form

I successfully used a linear equation to determine my profits. I calculated my hourly wages, predicted NET earnings for a year, and how much money I had made (and lost) over the actual amount of time that I worked for. My graphs are clear and functional, and I labeled them for easy understanding.

Understanding and solving: Apply multiple strategies to solve problems in both abstract and contextualized situations

I calculated all of the time, materials, equipment, and impact, in the cost of making my products. I used recycled materials and used a digital method of selling my product in order to create less waste. I chose to make products that I already had most of the materials to make, and still calculated the cost of the items that I had bought long ago.

Connecting and reflecting: Connect mathematical concepts to each other and to other areas and personal interests.

My business is sadly not sustainable as a full time job. I think this is partially due to the fact that I grossly under-priced my products for the security of making transactions. Realistically I should’ve priced my products in a way that would have me make more money on every transaction, which wasn’t the case mainly for the engraved items. Other businesses in the class, like Dana’s cookie sale, would make more money annually than I would but they both would not be sustainable as a full time job. Maybe with some remodelling and another go at this I could make a more sustainable business.

Conclusion

Honestly we do a lot of connecting our projects to the “real world” but I think this one was the first project that I think actually has an important connection to my future. I have always been interested in owning my own business/practice and this type of math is super important in that line of work and just general adult life. So now I can proudly say that I can do algebra and understand linear relations!!!

Thanks for taking the time to read this!

As always, Brooke.

A ✨Snazzy✨ Correlation

Have you ever heard someone talking about correlation vs causation? Perhaps in the latest season of Manifest on Netflix? Well that was the topic of this project, correlation vs causation.

Driving Question

How are correlation and causation different?

Causation is when A causes B or vice versa. It could also be when factor C causes both A and B. Correlation is when there is a relationship between A and B but there doesn’t necessarily have to be causation.

Project Overview

In this project we were to create a survey and video or formal presentation that compares a correlation with no causation and a correlation that does have a logical explanation of causation between the variables. We used numbers to create graphs to show the data that we collected from our surveys. This was also a partner project where we would be collaborating on creating a single project with our partner.

Project Start Mind Map

As per usual we started the scimatics project off with a project start mind map. I put in any questions I had for the project, what I already knew about correlation vs causation, and any ideas that I had for survey questions.

At the end of this project we also added to the mind map a section about what we learned from this project.

The Project

I think that the best way to show you the bulk of our project is by the keynote presentation that we presented to the class.  The presentation included information about our survey audience, our graph results, and our definition to the driving question. Here is the link:

A survey pour toi 

Curricular Competencies 

Planning and conducting: Select and use appropriate equipment, including digital technologies, to systematically and accurately collect and record data;

We found at least 3 correlations using our well crafted survey results. The survey results and correlations were displayed and explained through a keynote presentation to the class. We analyzed the graphs to confirm if there was cause for correlation because the line that automatically shows up was often misleading.

Communicating and Representing: Use mathematical vocabulary and language to contribute to mathematical discussions;

We created our presentation with helpful visual aids and well crafted written explanations. We had two main examples where we showed a correlation that we falsely thought would have causation and one that actually had correlation and causation.

Applying and Innovating: Contribute to care for self, others, community, and world through individual or collaborative approaches;

We used good ethics when creating the survey questions and conducting the survey. In class I was very focused and productive. I am very pleasantly surprised with my ability to stay on task while working on this project.

Conclusion 

So our correlations were not incredibly strong, but we were able to identify correlations and some causations in our graphs. We also found this project fun and it expanded our brain cells. I really enjoyed working with my good pal Dana and I hope to work with her again soon.

As always, Brooke.

IT’S THE EXPONENT APOCALYPSE

HellooOOooOooOOOOoooOOO and welcome back to another year of PLP blog posts. As you may have guessed, we just finished our first project in Scimatics 9. I found this project to be similar to the game about tectonic plates that we did in grade 8. The end result of this project was to be fun game that used exponent laws. And without further ado, I shall take you through the ins and outs of the creation of my partner and I’s game, the EXPONENT APOCALYPSE.

Starting off

As per any usual scimatics project, this project started with a project start mind map. The project start mind maps are a way to gather all of your knowledge and questions before starting the new project. I tried to write down all of the ways that math is included in games and what I already knew about exponents.

The project

We launched this project with a practise in creating game rules. As a group we were asked to create games that used a certain number of dice and involved addition, subtraction, multiplication, and division, in the rules. It was basically a toned down version of the final game that we would be making.

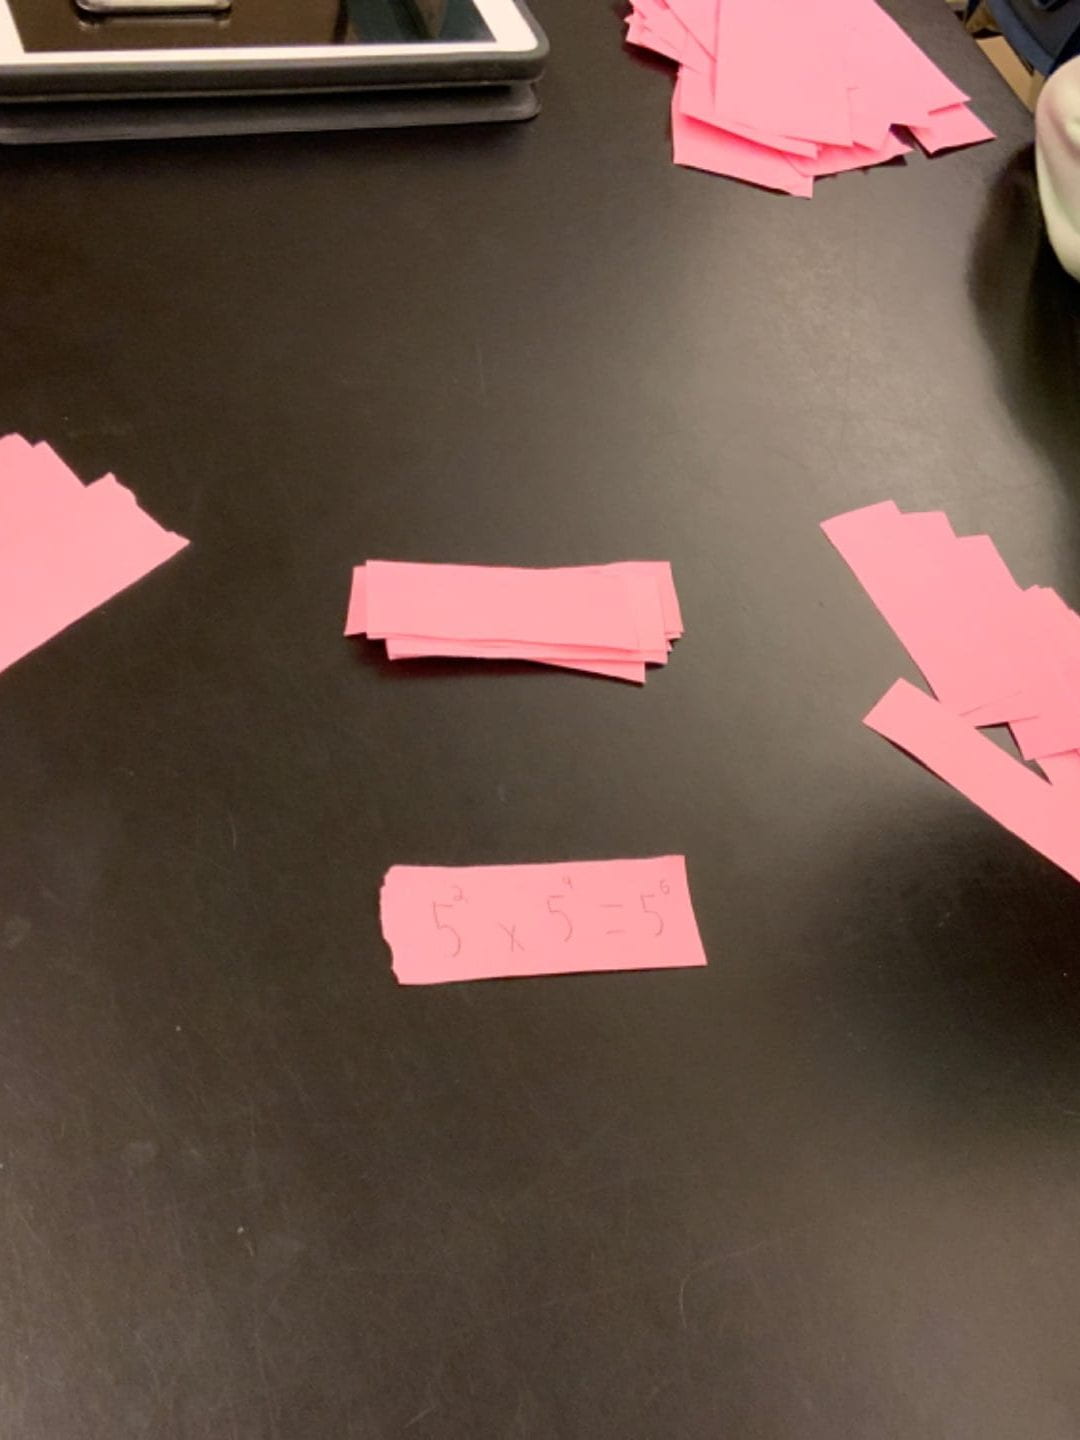
A huge part of this project was incorporating exponent laws into our games. And in order for that to happen we had to first learn about what exponents were and what laws they followed. We did a multitude of Kahoot! quizzes and workbook pages to really start to understand how exponents function.

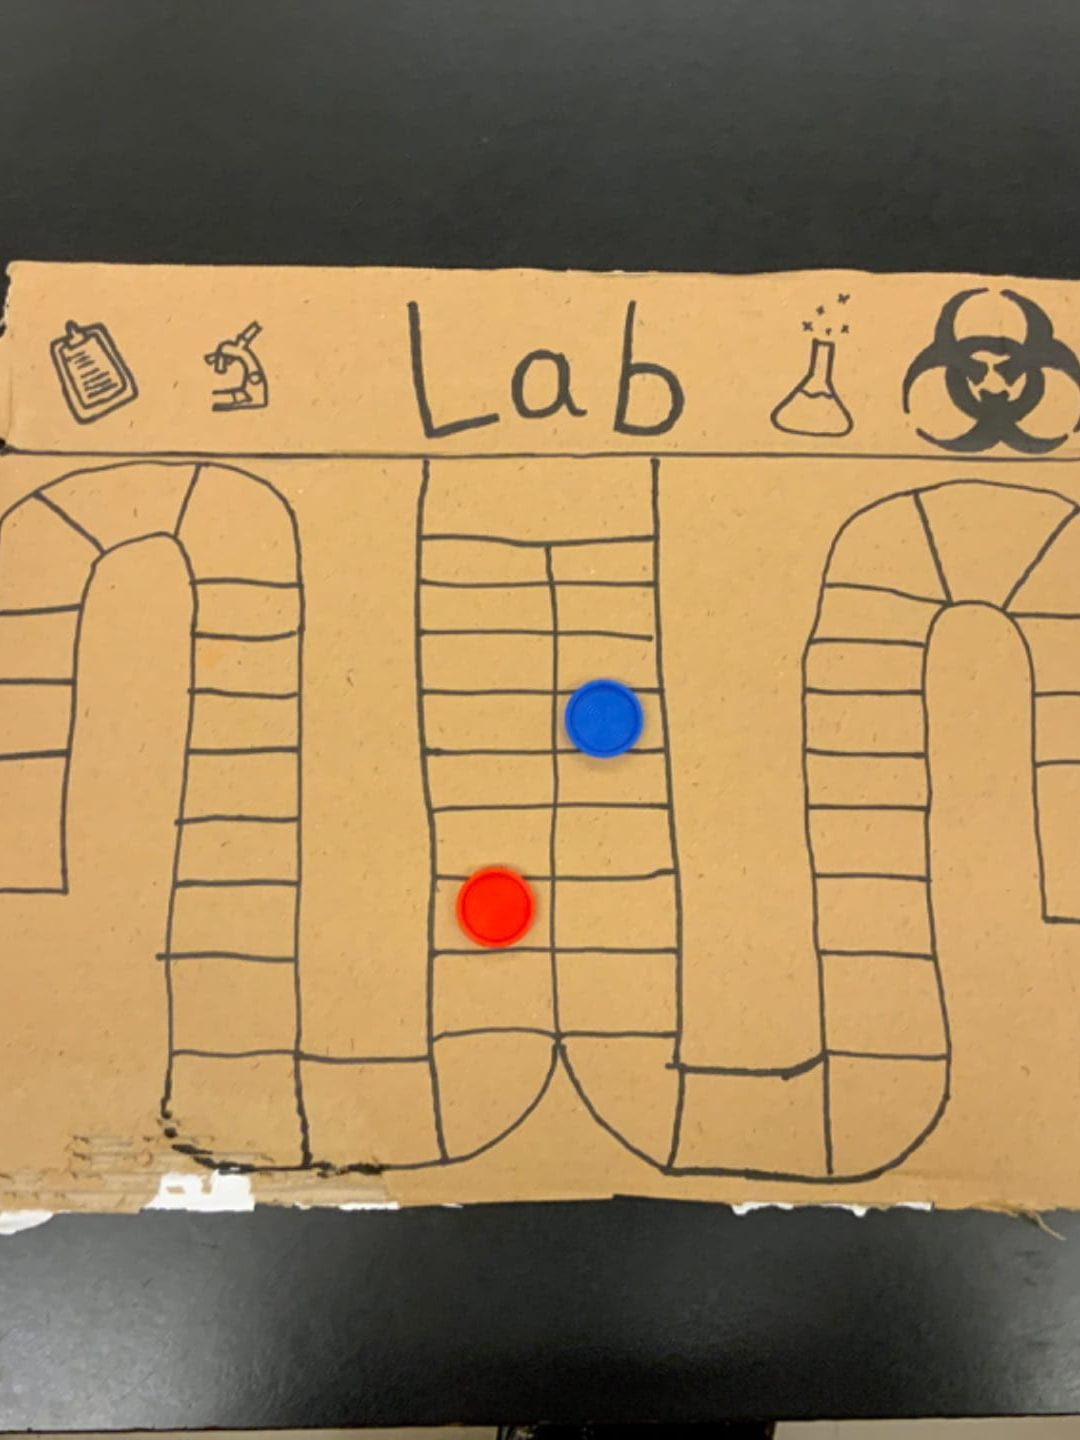
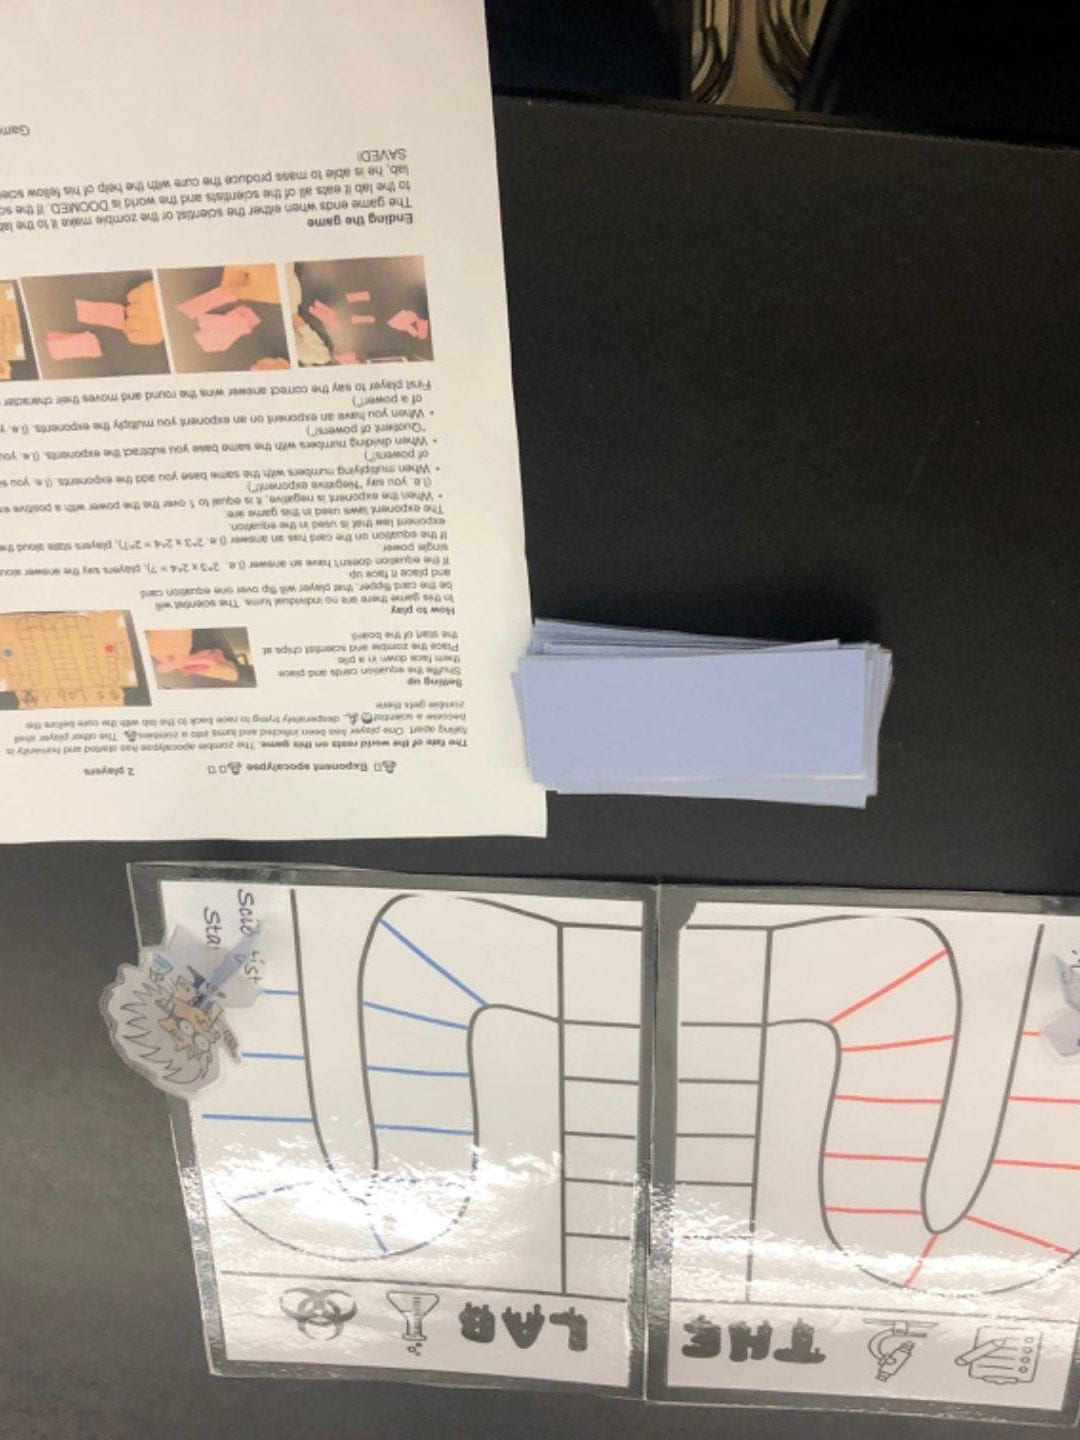
Throughout the whole project we were thinking about what we wanted our game to be. The rules, the points system, the objectives, even the game pieces. We made many drafts and had our friends test out our game constantly to see if there were any gameplay issues. Weeks later and we had our final game ready for game day. We call it “Exponent Apocalypse”, a mashup between Zombies and math. The goal is to get to the “Lab” at them end of the game board before the other player. You move up spaces by correctly answering the prompts on the cards flipped in front of you. Here, it makes more sense if you read the game rules; Exponent Apocalypse

Core Competencies 

Reasoning and Analyzing: Use logic and patterns to solve puzzles and play games

The points system in our game is quite simple, answer a question correctly and you get to move up one space. We wanted to make sure that we didn’t make it super hard or complicated to win because it’s more fun when you’re not confused half the time.

Communicating and Representing: Represent mathematical ideas in concrete, pictorial, and symbolic forms

This competency mainly focuses on the game rules themselves, if they are clear, complete, interesting, and personalized. Having an obvious theme to the game helped make the game more interesting to play because it gave it a bit of personality. We were going to add in a 5th exponent law to the game but we thought that that may get to complicated for people to remember while playing. Looking back we probably could’ve added another law without jeopardizing the simplicity of the game.

Applying and Innovating: Contribute to care for self, others, community, and world through individual or collaborative approaches

This year I am trying to stay more on track in class. I found that having a good partner like Faith really helped me to use my class time efficiently. Faith and I made an excellent team because our different skills worked alongside each other very smoothly.

Thank god this post is almost done

Well overall I’d say that this project was a success. I learned a lot about exponents and continued to learn about what makes a great game. Hopefully the rest of the projects this year go as smoothly as this one did.

Thanks for reading!

As Always, Brooke.

The Ultimate Bedroom Setup Noº3

Hi there 👋🏼

Welcome back to another scimatics blog post.

Fair warning, I am writing this post extremely tired.

Project description

In this scimatics project we worked in a small group to create 3D objects. We had to calculate the surface area and volume of the object we created and then put together a presentation for the class.

Driving question 

How can I design a bed to optimize its volume?

The main contributor of a bed’s volume is it’s mattress. A thick and fluffy mattress makes for added comfort and volume.

The project itself 

My group decided that we wanted to make a three part bedroom set. The set consisted of a bedside table, a bookshelf, and a bed. The object I was going to create was the bed. Before we started creating, we had to decide whether we would be designing the object for maximum surface area or maximum volume, I chose maximum surface area (but that didn’t work out for me in the end).

We would be using a 3D design website called Tinkercad.com  to create the object. At first, I found it difficult to understand the controls but after completing lots of the Tinkercad  tutorials I finally started to get it. I made a few sketches on procreate to help guide me with what the measurements of my bed should be.

My bed ended up looking like;

I also recorded a video where I scroll around to all sides of the bed. Just in case you were curious about what it looks like to use Tinkercad.

As I said in the project description, we needed to create a presentation about our 3D models to show the class. My original plan was to record us giving our presentation but I was so nervous that I forgot ☹️. So I made my group do a screen recording with voiceover so that I could still show y’all our presentation. Here it is;

The curricular competencies 

Applying and innovating: Contribute to self, others, community, and world through personal or collaborative approaches.

This competency was both harder and easier to achieve when working in a group with your best friends. On one hand we really worked well together and had no problem helping each other out. On the other hand I think that we could’ve done better at trying to keep each other on topic.

Reasoning and analyzing: Model mathematics in contextualized experiences. 

My model consisted of 11 basic 3D shapes and of those were 3 kinds; rectangular prisms, triangular prism , and cylinders. Sure my model wasn’t the most complicated but I made the design clean and it matched the other models in my group. I had originally intended the bed to have maximum surface area but later realized that the bed would end up having maximum volume if I designed it as I had planned.

Communicating and representing: Explain and justify mathematical ideas and decisions.

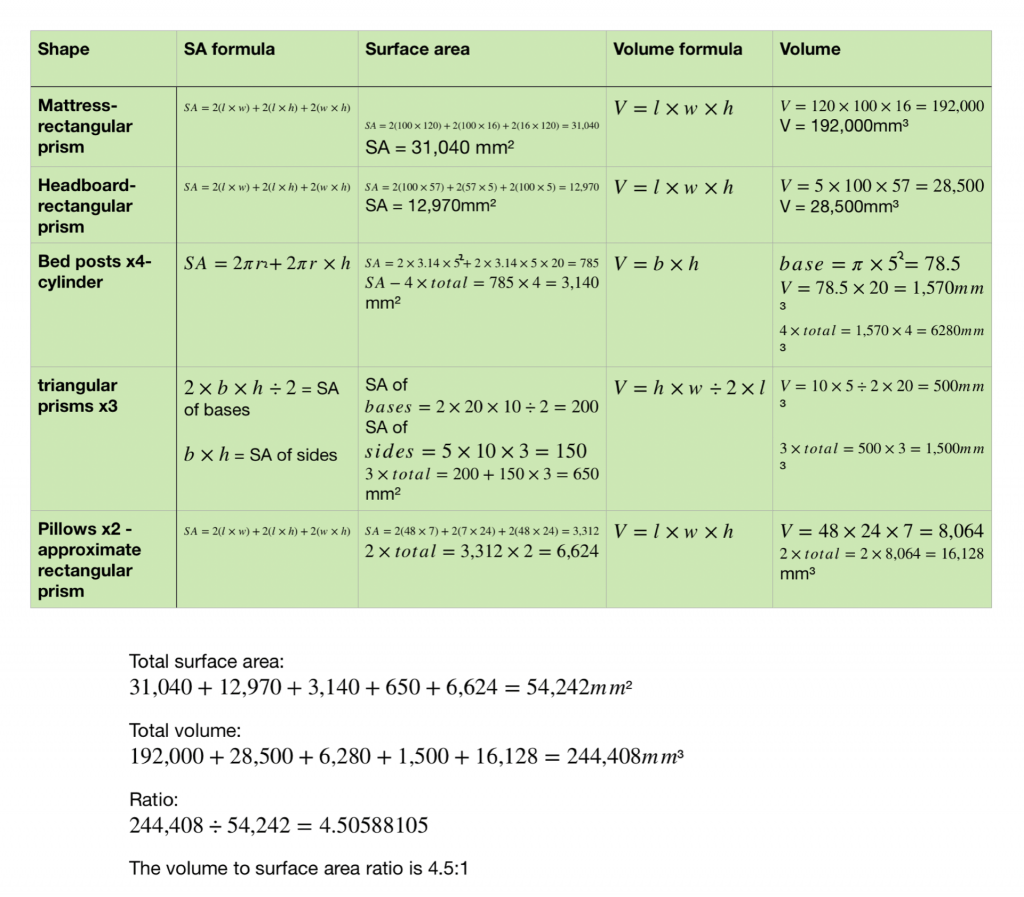
The calculations I made for my model were accurately measured and calculated. My milestone 3 shows the calculations which you can also see in the YouTube video presentation.

Milestone 3 calculations

Conclusion 

In conclusion, it was really fun working with my friends in a group project. I enjoyed learning how to use Tinkercad and I am proud of how I was able to create the model. I definitely feel like my math skills in calculating surface area and volume have improved a TON during the project.

Here are my group members posts on this project

Dana – The Ultimate Bedroom Set Up Noº1

Makenna – The Ultimate Bedroom Set Up Noº2


Thanks for reading!

As always, Brooke.


PEW! PEW!

For this project we had to make a fully functional laser gun to use in epic battles with aliens……..

Just kidding

This project is about using the Pythagorean theorem and the laws of reflection to        create a laser triangle. 

“LASERS?!? Aren’t those dangerous?”

We aren’t using those types of lasers you see in movies that can cut through metal and slice off fingers. The lasers that we use are just rays of coloured light. Just like those laser cat toys:

Building knowledge 

Atthe start of this project I had no idea what the Pythagorean theorem or law of reflection was. So obviously we had to do lots of building knowledge. We were out into our project groups to come up with all the questions we had for this project.

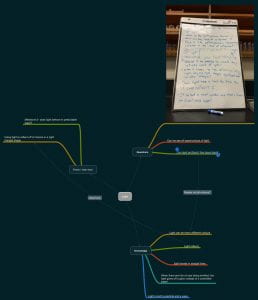
We then started a project start mind map just to gather all the information that we already knew. Here is a comparison of my mind map at the begging and end of the project.


We also did a really cool lab to learn about frequency and amplitude in waves.

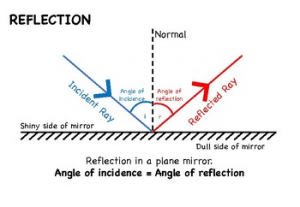
Now what is the law of reflection? The law of reflection is the fact that the angle of incidence and the angle of reflection will always be the same distance from the normal. As you can see in the diagram below, the normal is an imaginary line that is perpendicular to the reflective surface. We did lots of practise measuring the angle of incidence and reflection with accuracy so that our final project could be precise.

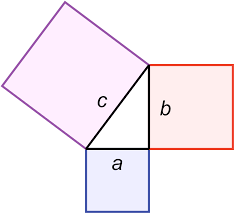
We also had to learn about using the Pythagorean theorem. Pythagorean theorem is used to measure the side lengths of right angle triangles. The formula is A ² + B ² = C ² or Leg ² + leg ² = hypotenuse ². The Pythagorean theorem also states that the area of the square formed by the longest side of the right triangle (the hypotenuse) is equal to the sum of the area of the squares formed by the other two sides of the right triangle, the hypothetical squares look like this;

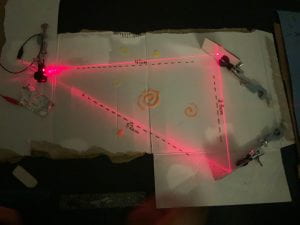
Our final laser triangle- milestone 5

The end goal of this project was milestone 5, where each group had to create an accurately planned laser model that included at least 1 right triangle. My group didn’t have a lot of ideas for what we wanted ours to look like but we decided that we would try to create the laser off the ground by elevating everything with stands and clamps. The whole point of the model was that it was supposed to be able to be measured accurately, especially the angle of incidence and angle of reflection. We ran into a big problem when every time we tried to set it up something had shifted or changed in height. With only two days left until the project was due we decided to scrap all that we had worked on and remake the triangle on the table like everyone else. We were able to measure more accurately and it was much easier to mark the position of the mirrors and laser. On the final day I brought in my glue gun and some glitter because we basically just had the project sitting on a white piece of cardboard that had marks all over it. What I’m trying to say is that even though our project was fully functional it looked….. bland. But there is almost nothing that glitter cant fix so with a little bit of white paint and pure creativity our project started to look pretty good. Here are some photos of what we made + a short write up;

Final triangle design pdf


   Core competencies

  • Questioning and predicting: How can I demonstrate a sustained intellectual curiosity about a scientific topic or problem of personal interest? The milestones that correspond with this competency are; Milestone1- project start mind map, milestone 3- law of reflection group lab, milestone 4- lazer design lab individual, milestone 5- final laser model. This competency is about using your class time efficiently to do your work without distractions. This competency might not seem hard but definitely is something that I know I can do better on. In the final days of making the physical model my group had to scrap our original idea and start from scratch. It was really hard to stay focused on the project when it seemed like a sinking ship. We ended up pulling ourselves together and I am very proud of the final stage of our laser model.


  • Communicating and representing: how can I represent mathematical ideas in concrete, pictorial, and symbolic forms? The milestones that support this competency are; Milestone 2- Pythagorean khan academy quiz and milestone  6- the blog post. This competency is about being able to develop a scientific procedure that is accurate and includes all required steps of a scientific method. Even though the project outline only links two milestones to this competency I would actually like to add more. I think that I used this competency in milestones 3, 4, and 5, when I had to write up about the experiments. Overall I think that I improved the most on this competency compared to the other two because I got more comfortable and confident the more I worked on this competency.


  • Applying and innovating: how can I co-operativly design projects? This competency is used in; Milestone -4 individual lazer design, milestone 5- final laser model, and milestone 6- the blog post. This competency is about having an accurately planned, labeled, built, and measured laser triangle. This competency also talks about all group members contributing equally. Yet again I would also like to add milestone 3, the law of reflection group experiment, to this competency because that was a group project that corresponded with the values of this competency.

 Now its time for my goodbye statement.

This project was really fun and I obviously couldn’t have done it without my group. Big thanks to Claire, Ariane, and Theryn.

As Always, Brooke.

Am I a screen addict?!?

New quarter, new class. Our first scimatics project was rather short- Just for us to get a feel of what scimatics would be like. The driving question for this project was “What fraction of our time is screen time?” From my calculations, I spend just over 1/4 of my week on screens.

In this project, we made a spreadsheet that calculated what time we spend doing things like screen productivity, entertainment, exercise, sleep, etc. We started right away on making the spreadsheet so that we could track a complete week. Most of us did not have a bunch of previous knowledge with the Numbers app so we learned some really cool tricks on how to use numbers and how to customize cells. The competency that went along with this part of the project was Understanding and solving: Visualize to explore mathematical concepts.

Another one of the competencies we were learning was how to represent mathematical ideas in concrete, pictorial, and symbolic forms. We were showed how to add pie charts and graphs to display the data we collected in different forms. The goal was to find as many ways to display the data as possible. I made 6 pie charts, 4 bar graphs, and 1 line graph. 

We also did lots of homework practise sheets to strengthen our knowledge of fractions, decimals, mixed numbers, and percents. I was pleased to find out that I’m actually pretty good at working with fractions because I know that those skills will help me in the future. I used the competency of applying and innovating by being productive and using my class time wisely. My table partner and I talked often and helped each other out when we got stuck on a question or task.

I really enjoyed colour-coding my screen time tracker and it was super fun to try to find different graphs and charts to make. I was glad to find out that I don’t spend an incredible amount of time on my screens but I would like to try to bring that number down a bit. Also I’m not entirely sure what I was doing on Thursday but apparently I had a lot of screen time that day. Anyways, thank you for reading my short reflection of my Screen time tracker 2020.

As always, Brooke.