Screen Time Chart Reflection
This is another reflection but this time its about Math in a class called scimatics and the driving question is: how much of our lives is screen times. My results are not quite as good meaning I’m on screens more then i thought here’s my chart about my screen time.
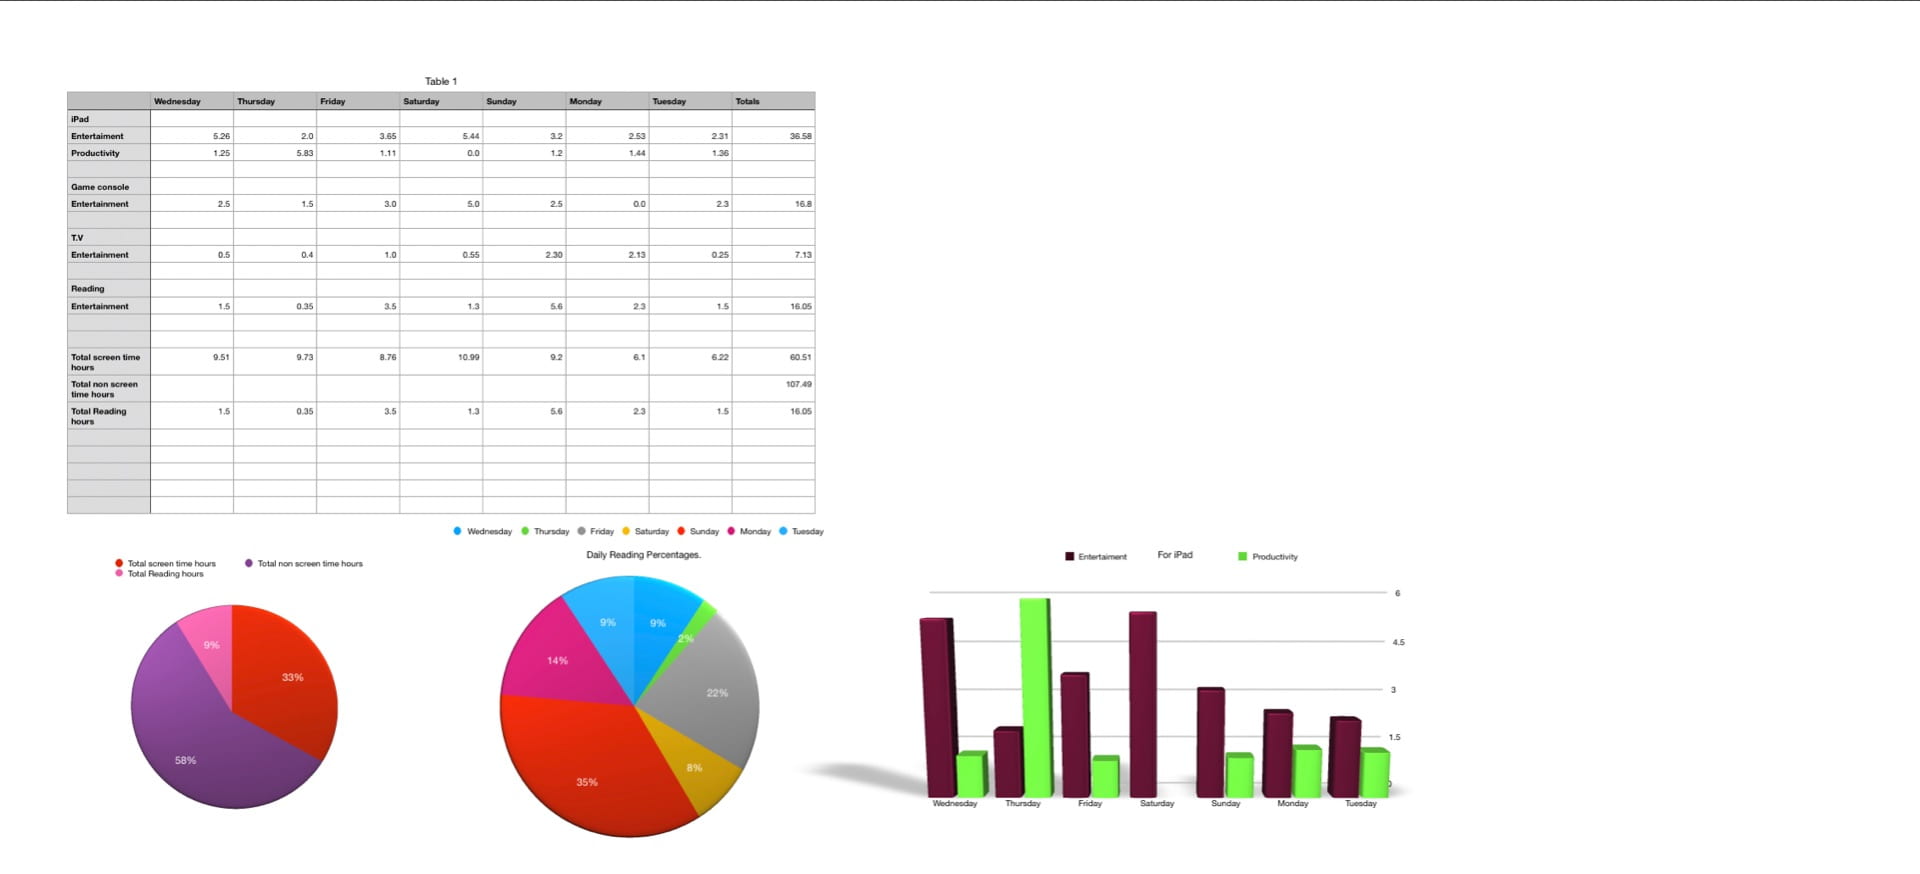
The pie chart on the left is tracking my screen time and non screen time as well as my reading time. The one in the centre tracks my daily reading averages. The last one compares my entertainment to productivity on my iPad.
The answer to the driving question is our lives are heavily involved in screens. And I would say that half of our lives (or at least mine) is half screen.
Curricular competencies there were 3 curricular competencies the first one was: Applying and Innovating: Contribute to care for self, others, community, and world through individual or collaborative approaches. How I did this is I used my class time wisely and only letting my self be distracted a couple times once I was done with the task.
The second curricular competency was: Understanding and solving: Visualize to explore mathematical concepts. I kept a accurate spreadsheet to track my screen time and I also had the pie charts to compare percentages of my reading time (as seen above).
The third and final curricular competency was: Communicating and Representing: Represent mathematical ideas in concrete, pictorial, and symbolic forms
I did this again with my pie charts and I also had a graph to compare my productivity to my entertainment (see image above) and unfortunately I had a lot more entertainment then productivity.
This is cool