Driving Question: What did European Settlement mean for all the people involved?
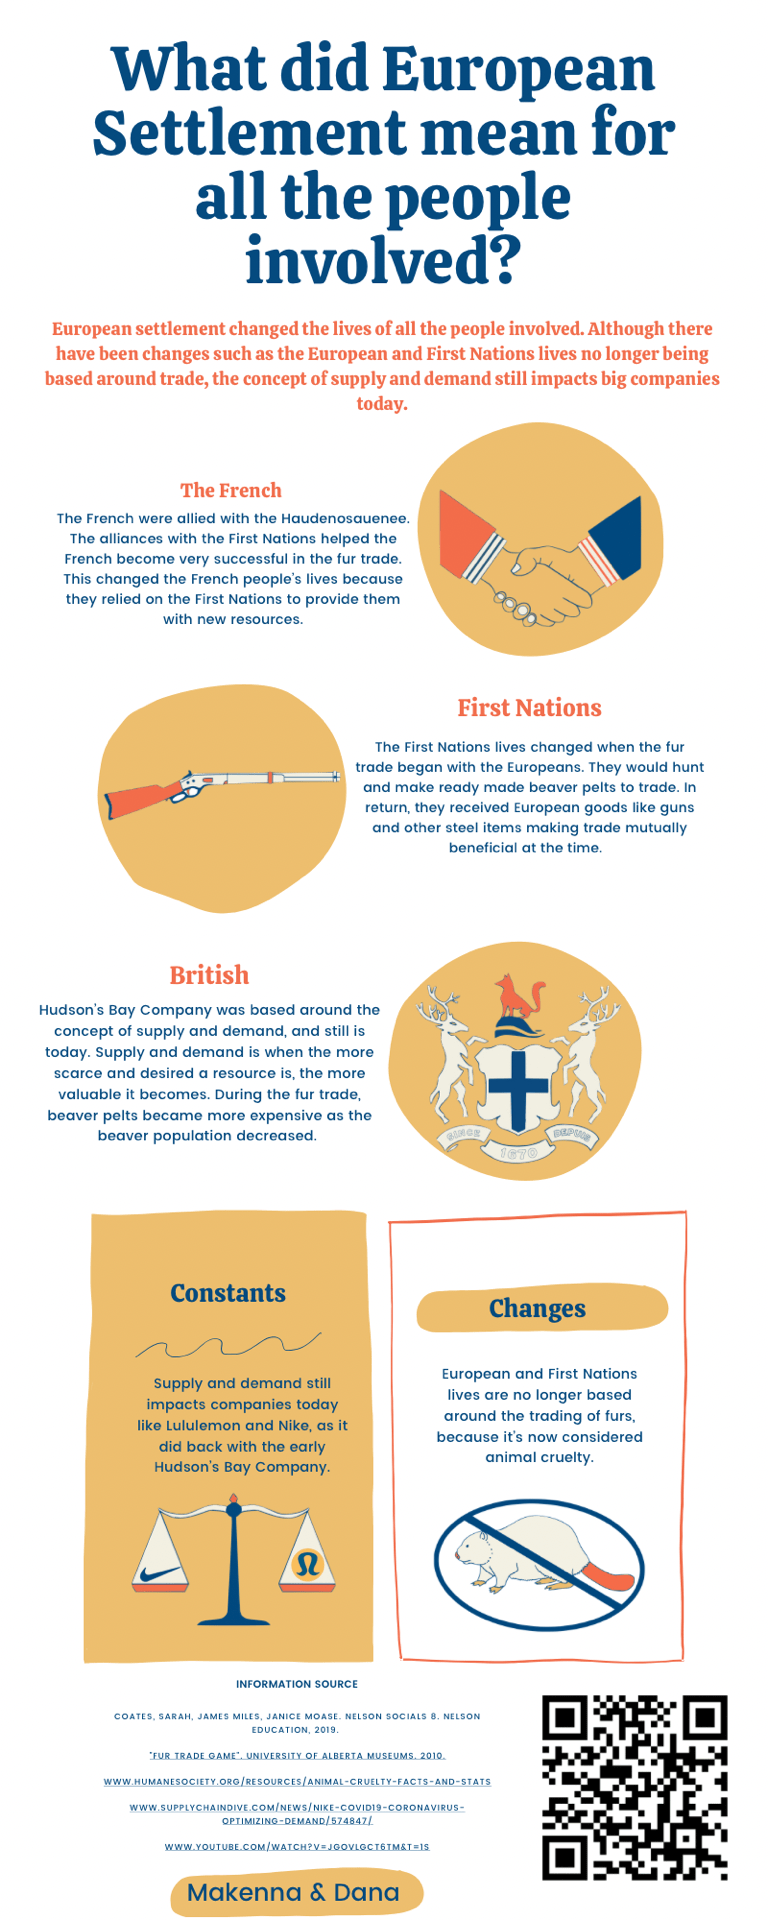
Answer: European settlement changed the lives of all the people involved. Although there have been changes such as the European and First Nations’ lives no longer being based around trading, the concept of supply and demand still impacts big companies today.
Welcome back to my blog! I haven’t written in a while, but I’m back! The past project that we just finished was suppper fun! Isn’t that infographic above so cool? Haha well if you liked that, then read the rest of this post! I will be explaining all the steps me and my partner took to create this very snazzy infographic. Well, at least I think it was…our project was about European Settlement in Canada, which you will be hearing a lot about throughout this post.
So basically in this project, we had to create an infographic about European Settlement. Click here to find out more about infographics. My initial reaction to this project was this is going to be soooo boring, I’m going to hate this. However, I was proven VERY wrong later on in this project. Also, I was super lucky to be paired with one of my best friends for this project, Makenna, so that definitely made it really fun. Anyhoo, lets get into this post!
I think what really started this whole journey off was the introduction to Milestone 1. In order to have a successful Milestone 1, we learned about Continuity and Change and the history of Deep Cove. Now you might be wondering “Dana, what even was Milestone 1?” Well Milestone 1 was a 1-2 page reflection on the constants and changes in the North Vancouver/Deep Cove area. In this Milestone, we had the opportunity to demonstrate the Curricular Competency identifying Continuity and Change. Overall, I think I did ok for this Milestone seeing as it was the first time I had learned about Continuity and Change.
The next Milestone really changed the course of this project and it was Milestone 3. In the time span between Milestone 1-3, we learned about what makes a good infographic and and we learned waaaaay more about European Settlement. We also learned about aesthetics. We had to create graphics that matched our pre-determined infographic. Below is the template we had to use:
Here’s what makes a good infographic:
- Tells a good story
- Take your users on a predefined journey – simple
- Provides a new angle
- Practical value – inform, bring them something they didn’t know
- Content should be well structured – easy to understand
- Sends one key message – don’t make it too complicated
- Visually appealing – clear title
- Accurate & well researched
- Make text short and sweet – don’t copy paste content
Milestone 3 was basically we had to come up with three graphics and three facts to add to our infographic. Here are the three graphics we created:
1.
2.

3.

And here are the three facts:
The French:
The French were allies with the Haudenosauenee. The alliances with the First Nations helped the French become very successful in the fur trade and changed the French people’s lives because they relied on the First Nations to provide them with new resources.
The First Nations:
The First Nations lives changed when the fur trade began. They would hunt and make ready made beaver pelts to trade with the Europeans. In return, they received European goods like guns and other steel items that made their everyday lives easier.
The British:
Hudson’s Bay Company was based around the concept of supply and demand, and still is today. Supply and demand is when the more scarce and desired a resource is, the more valuable it becomes. During the fur trade, beaver pelts became more expensive as the beaver population decreased.
Later on, we would come back to these facts and graphics and revise them many, many, many times. In this Milestone, we had the opportunity to, again, demonstrate identifying Continuity and Change. Overall on this competency, I think I had grown a lot since Milestone 1. I showed that I could identify Continuity and Change through my facts. A new competency that we were introduced to in Milestone 3 was Using Evidence. In Milestone 3, I feel we did quite well on this. We provided sources for all our information. We also backed up what our facts were say with research.
Another Milestone that was super course changing in this project was Milestone 4. This is what you saw at the top of the page. It was when we added everything that we had done throughout this project, and put it all together to make one super awesome infographic. In between Milestone 3 and 4, we tweaked and poked at our graphics and facts until we got them just how we like it. Basically what I’m saying is we revised our infographic more then I care to admit…anyhow this Milestone shaped what our final product would look like. I think this is where you can really see my growth as a learner from Milestone 1 up until this point. In Milestone 1, I had just learned about Continuity and Change and about the history of Deep Cove. But now, in Milestone 4, I was pretty much a pro at European Settlement and Continuity and Change. In case you missed it, here’s our final infographic (again, and if you can’t tell, I’m very proud of our work):
As a side note, you may see that we have a QR on our infographic, click here click here to see what it is.
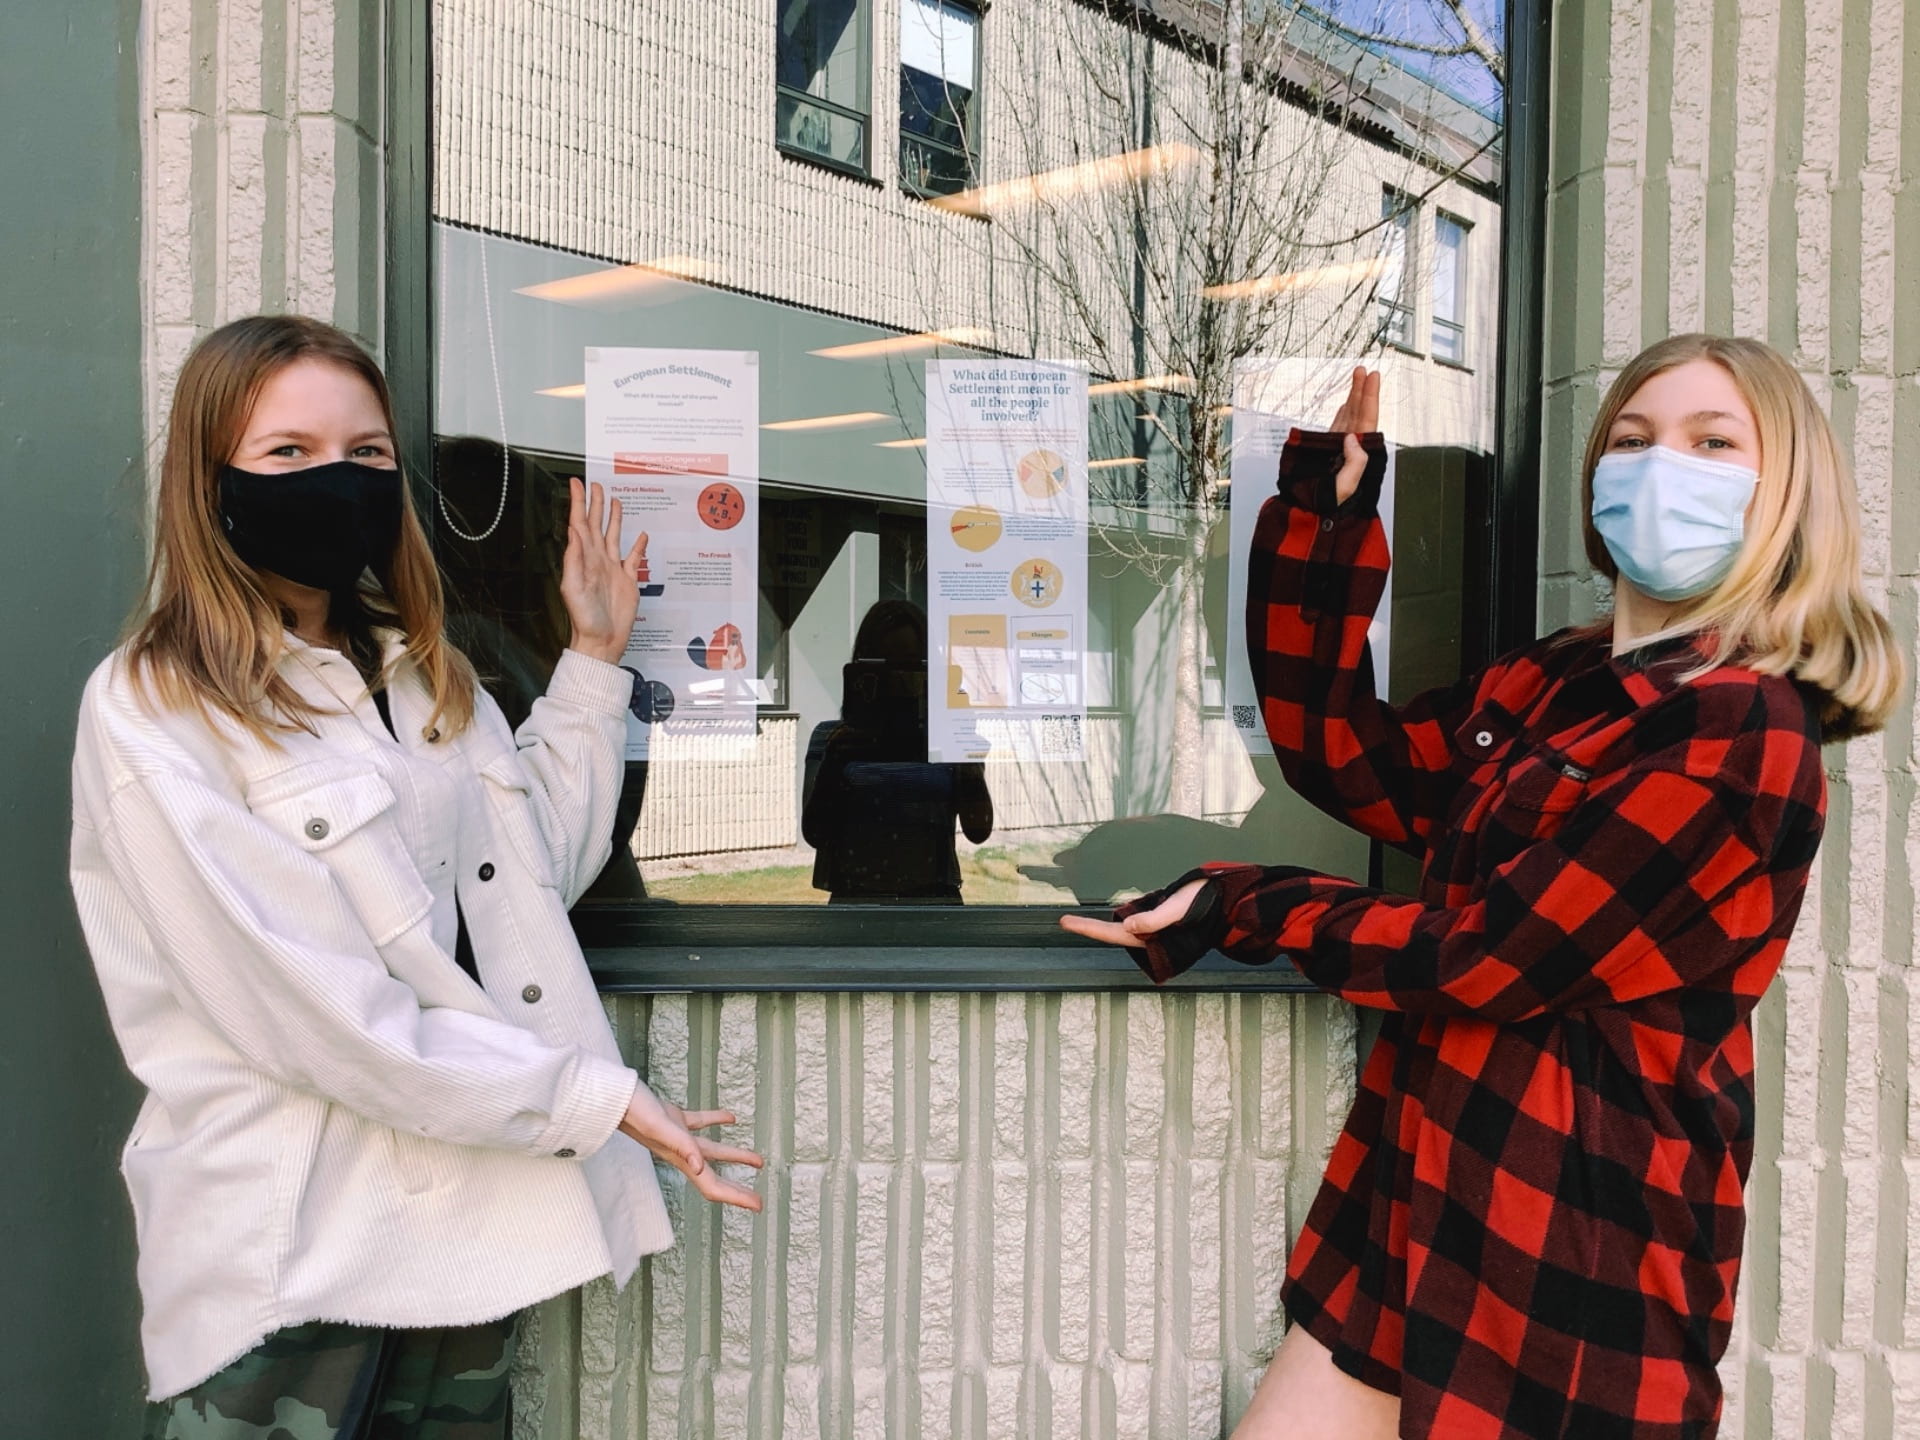
Milestone 5 was pretty short. All we did is we got our final infographic printed out (thanks Ms. Maxwell!) and we hung them up around the school. Below is the picture of me and my partner Makenna standing with our final infographic that we had to hand in:
Anyhooo thanks for reading my post! As you can tell, I have learned so much from this project about European Settlement, Continuity and Change, and about infographics! This was as huge project so if I missed something, please be sure to let me know in the comments and I will add it in (make sure to follow my commenting guidelines). Thanks again for stopping by!
Best wishes,
-Dana
P.S. Big shout out to my parter Makenna! This infographic would not have looked half as good if you hadn’t have been there!
P.P.S. Here’s what I got on each Milestone and the feedback I got:
