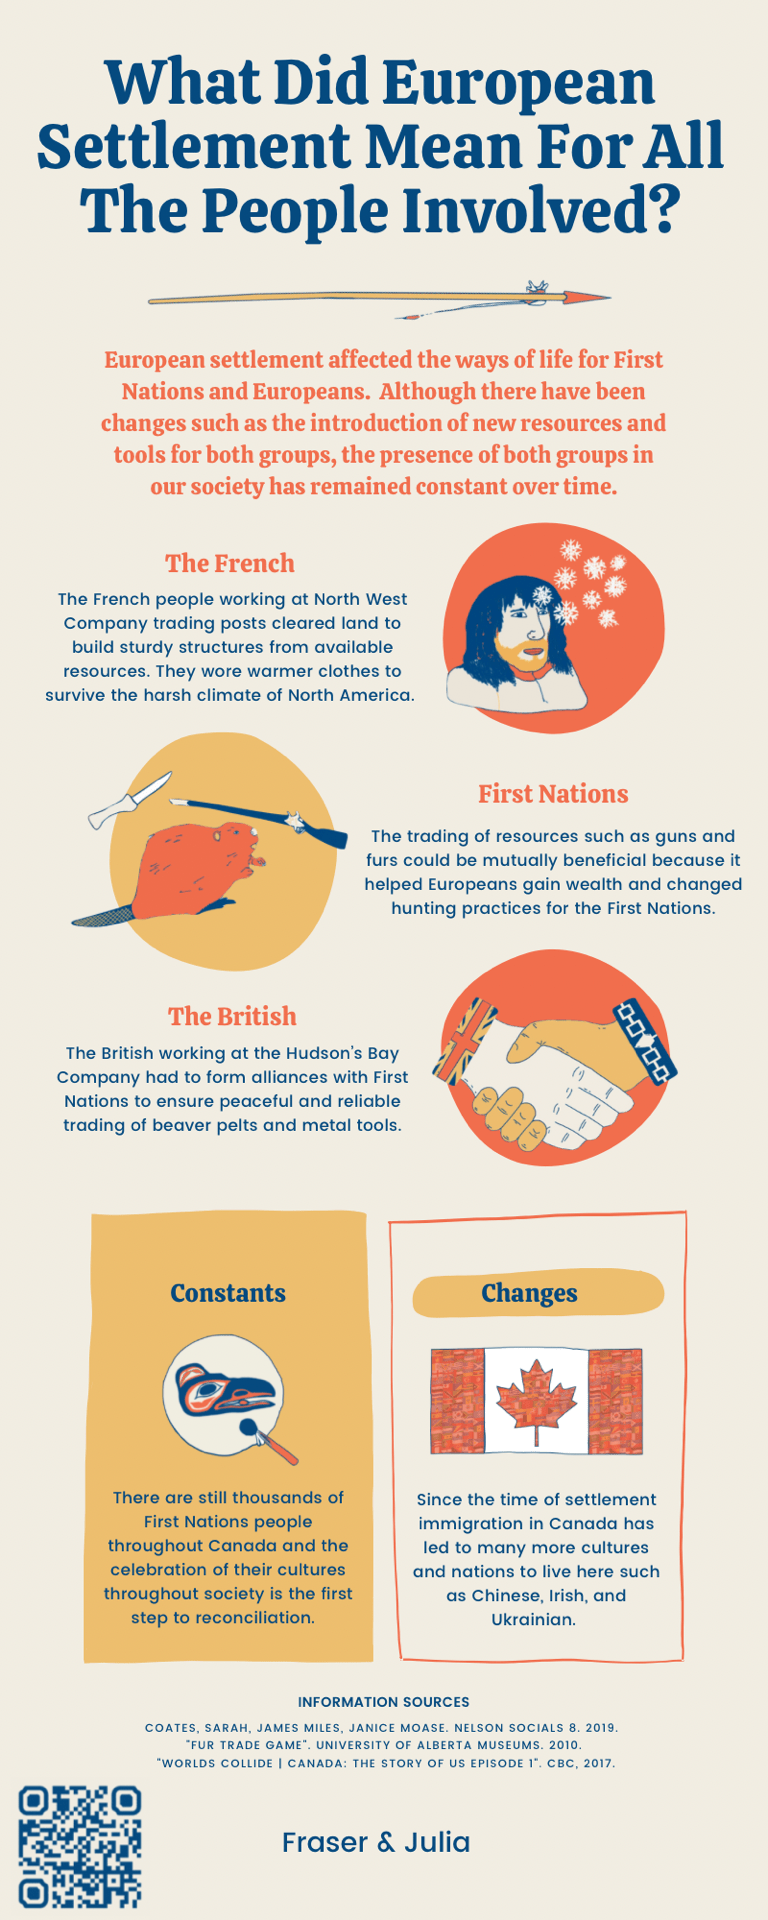
In this project we worked with a partner to create an infographic about how European settlement affected all of the people involved, which included the French, British and First Nations.
First things first: Thanks to my partner for this project, Julia, for being such an awesome, reliable and hard working partner! I really enjoyed working with her to create our infographic and think we divided up the workload evenly, helped each other out and overall were a successful team.
Moving on, this project’s driving question was “What did European Settlement Mean For All The People Involved?” I think that our thesis (that’s the text right under the title of our infographic) does an excellent job of answering it: European settlement affected the ways of life for First Nations and Europeans. Although there have been changes such as the introduction of new resources and tools for both groups, the presence of both groups in our society has remained constant over time.
The first step for me to help develop our conclusion (the thesis) was Milestone 1. In Milestone 1 we wrote a reflection on Deep Water, now known as Deep Cove. We used the knowledge we gained from Ms. Maxwell’s lecture and accompanying Keynote presentation to write about the history of Deep Cove.


We compared how lives and conditions are alike over time and how they changed, hence the competency Identifying Continuity and Change. I feel that this Milestone really helped me to understand how to identify continuity and change and how to connect them to today. You may read my Deep Cove reflection here.
The second milestone that helped me engineer our final thesis and supporting facts was Milestone 3, in which we were able to use the information provided to us by the teachers to find facts to support our thesis and then concisely summarize them into a few sentences for the infographic. I found that this video by CBC was very informative and provided an engaging insight into the arrival of the Europeans and life in New France. (Some of this video is a bit gory so viewer discretion is advised.)
This Milestone helped me understand the competency “Use Evidence from Various Sources: How do we evaluate evidence to decide if is adequate to support a historical conclusion?” I think that overall I did pretty well on this competency, however I feel that we could have made our facts more specific.
We assembled all of our facts and information with the app Canva, with a predesigned infographic template.
We drew our own graphics using the apps Keynote and Procreate with the help of our Pencils to help tell the story of European Settlement.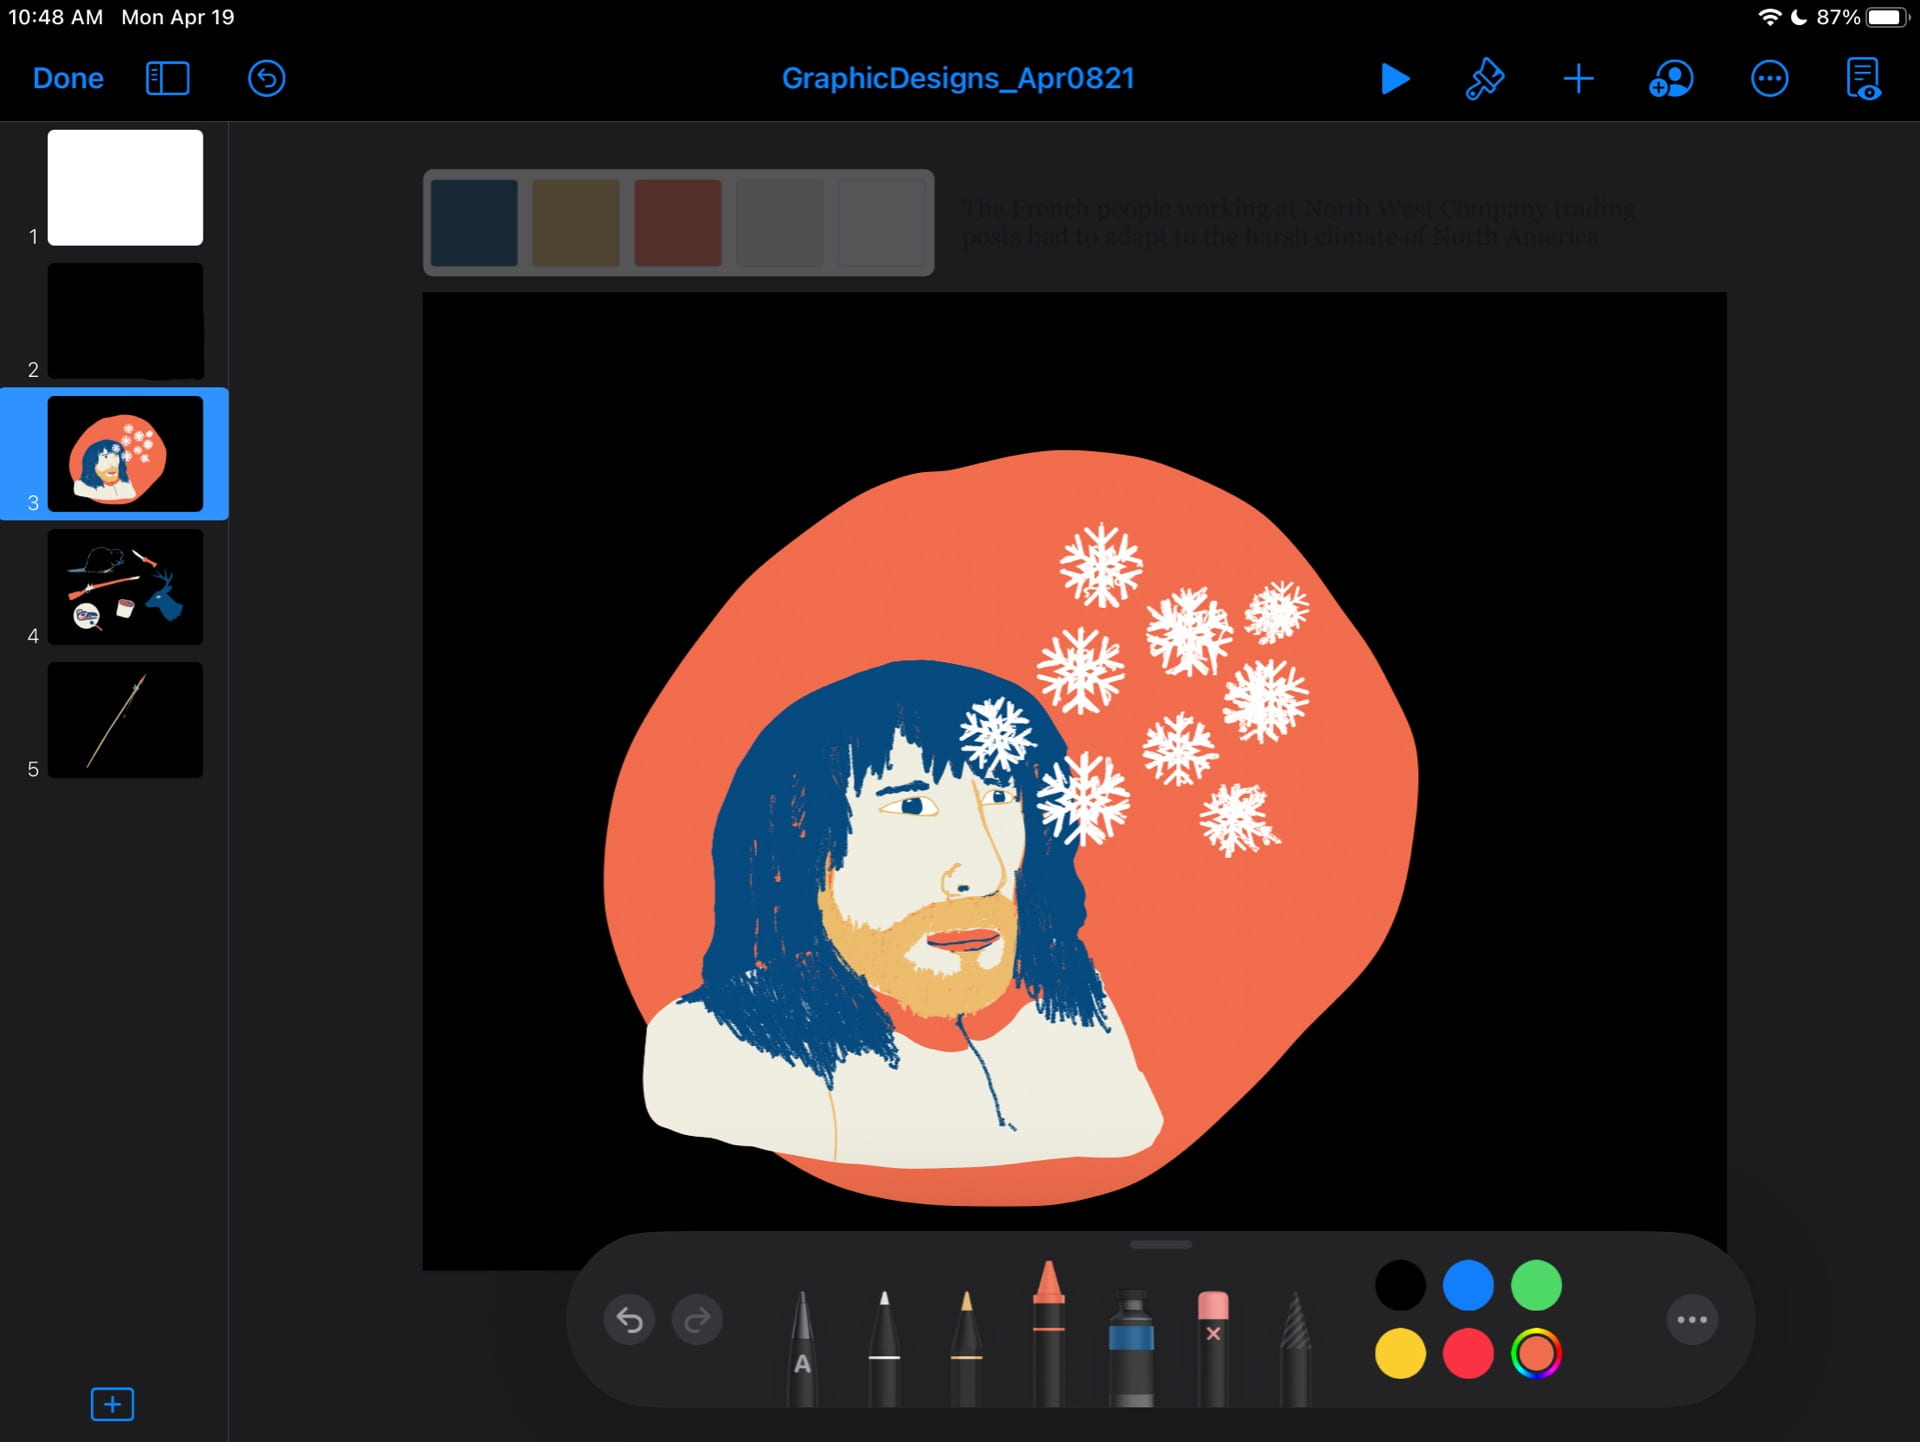
Once our infographic was complete (after several rounds of critique from peers and teachers) we used Keynote to create a video that dives a bit deeper into the information on our infographic. We used Keynote’s Magic Move transition so it would scroll through our infographic while we spoke.
Unfortunately Keynote kept crashing while I was trying to export the Keynote as a movie. Thankfully Julia’s iPad Pro was able to export the movie! (Guess iPad Air isn’t powerful enough) I am very proud of the end of our video:
The final step was putting our infographics up around the school!
I really enjoyed learning about European settlement, Deep Cove, continuity and change… the list goes on! This project was one of my favourites this year, I enjoyed using the minimalistic style of infographics to share information. Alas, Humanities and Maker are over for this year, I can’t wait for next year. Next up Scimatics…
I’d love to hear your favourite fact, graphic, part of the video or anything else in the comments below!