Another day and another project finished. For this project we made a infographic on the European settlement with a partner. Now if you don’t know what an infographic is here is an example of one:
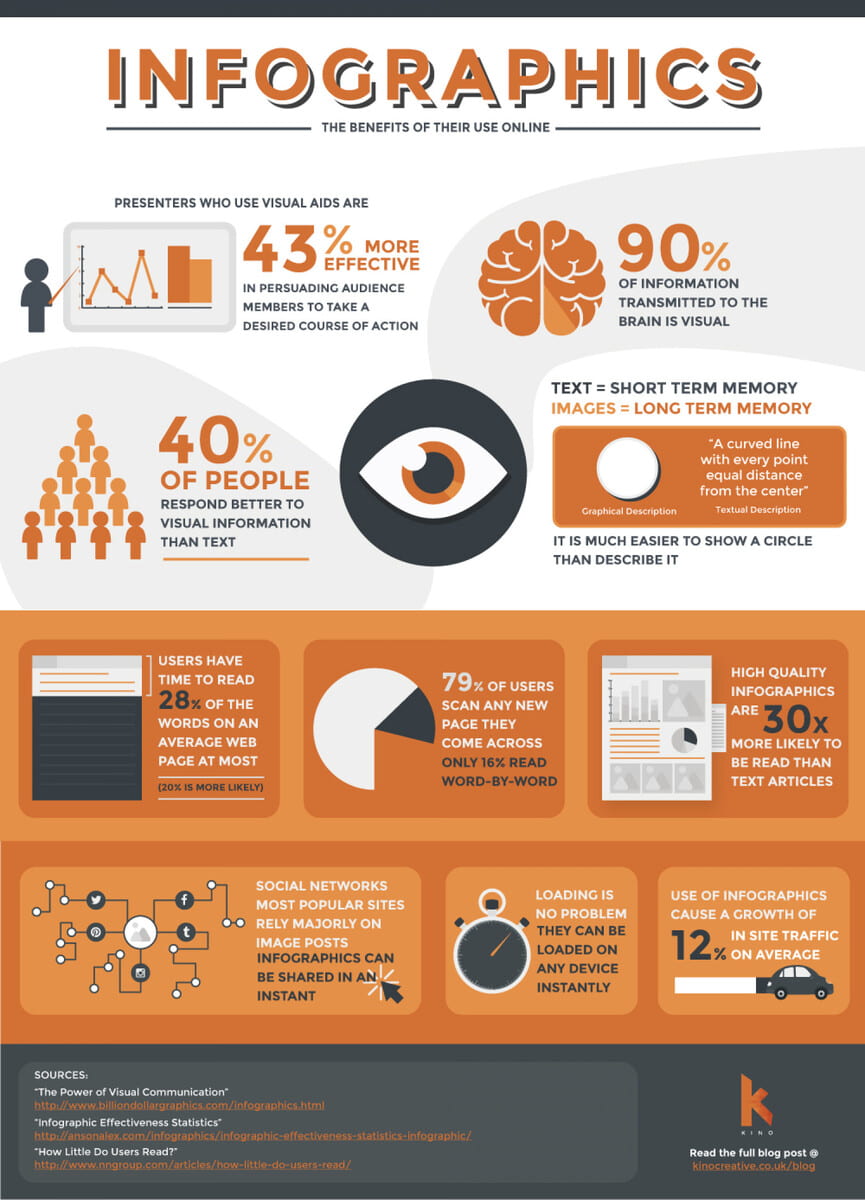
As you can see it uses concise paragraphs or sentences along with graphics to help explain or enhance the topic of the infographic. Over a couple of weeks we learnt about the European settlement and everyone involved, the French, the British and the First Nations. Are teachers gave us a choice on what part of the settlement we made the infographic, and we chose greed in the European settlement. My partner and I made informational mini paragraphs about each group to add to our infographic about the topic we chose. Then we made the graphics to go with the paragraphs that keep with the aesthetic of the infographic. After that we did some tweaking and revising until it looked like a professional infographic. This project was really fun and I’m really happy about how it looks, i hope you like it and learn something!

You can scan the QR code to get a different way of learning from our infographic.
See you next time.
here is my partners blog!
check out their post on this project.