For this project we had to total our overall screen time and put them in one big chart marking how much screen time we used then later totalled up all of the numbers. I had the standard categories, iPad time broken up into 2 parts by entertainment and productivity. Productivity being school work and entertainment being games and whatnot.
The next category was my phone. It surprised me how much time I spend on my phone. Last week before this project i spent 44 hours on my phone. This week I spent almost 20 hours on my phone most of the time coming from Tik-Tok where i spent at least 1 hour on a day. Next was Netflix and i had surprising low amount of time on Netflix. Throughout the whole week I watched 5 episodes of Young Justice and 1 movie, Batman: Death in the Family, overall Netflix took up 4 hours or in a percent, 7% of all of my screen time. My next category is video games. I spent a lot of time on video games. Maybe to much. I averaged about 3 hours a day and on Friday i spent 6 hours. Yea that’s a long time. My last 2 categories are exercise and sleep. My exercise was broken into 2 parts as well, indoor exercise and outdoor. I did a 30 minute workout every day and a hour and a half workout on Tuesday. For my sleep I got about 8 hours of sleep which is pretty average for a kid my age.
This project helped me be more conscious about the time I spend on electronics. Also because my dad said if my screen time was too high I would have restrictions but it was mostly the project that made me be more aware. Not only did this project make me more aware, it also helped me learn how to use numbers ( the system we used to make the chart) better. Before I didn’t even know how to make a graph and now I can program the chart to make graphs for me.
Throughout the way of getting to our final goal of making the chart, we also had daily math homework about adding and subtracting fractions and mixed numbers and turning numbers into percentages to help with making the chart. It definitely helped me out because I haven’t done fractions like this sense grade 5 and 6, so it was a good refresher. For the chart itself i decided to go with a colour combination of red yellow and orange. I made the background green to make everything else pop and the charts where also red yellow and orange. I had different charts 1 being the total screen time hours and total non-screen time hours. Another one being a comparison of the total time I spend on certain electronics like iPad and iPhone and tv and video games
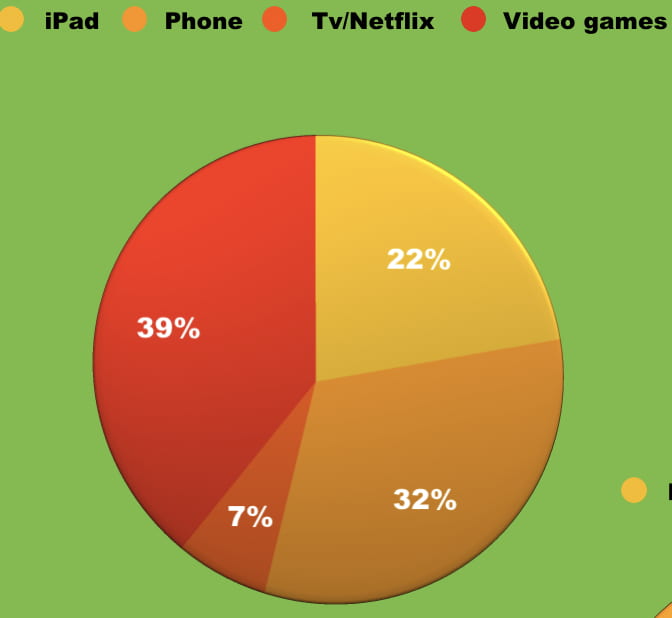
As you can see I spend majority of my screen time is on video games then my phone. This project was pretty short because is only took a week but I definitely learned a lot from the project and am looking forward to more science and math based projects because this one was pretty fun.
We had three core competencies that we had to accomplish over the course of this project.
The first core competence was applying and innovating. Which is basically just using your class time affectively which I accomplished very well. I used my class time very wisely and got my work done in class leaving me to do little to no homework at night. I was pretty focused in class and the task at hand which paid off well.
The second competence was understanding and solving, where we had to make a spreadsheet of the time we are on screens. I did that and added a few of my own stuff as well. I added some colours to spice it up and added a few more numbers and the end of each row showing my total hours for each subject. I also showed my understating of fractions and percentages by doing the daily homework and presenting the fractions and precentages on my spreadsheet.
For the third and final core competence it was communicating and representing. What that is saying is that we had to show our pie chart which had the precentages of the numbers on the spreadsheet. You also had to show at least one more interesting chart while i showed four. I also picked a colour pallet and made all of the charts match in colours.

Here is my finished chart take a look on the hours I logged for each subject.