Hey guys welcome back to another blog post! Feel like a content creator saying that. On a real note we just finished another scimatics project and it was called Correlation vs causation. The main idea of the project was we had to make a survey for a certain audience using questions that may or may not correlate with each other. The driving question for the project was how are correlation and causation different from each other? Ill answer that later in this post and take you through the struggles and the accomplishments throughout this recent project.
This project was definitely a little more of a struggle than normal because of me having to do the majority of it solo. The cause for that is that my partner was in New York for around a week and a half. The parts of the project that I did while he was away were choose the question that’ll be put on the survey, actually make the survey which was a bit of a struggle(ill tell you why) and send the link to the survey out for people to do. Building the survey was a struggle because originally I heard that we were supposed to do it in google something, so I searched up how to make a survey on google and the first thing that came up was google forms, so I assumed that’s what they were talking about. I made every question on there have 5 different multiple choice answers including a picture, making the survey very visually appealing. After I finished it turned out that it’ll cost $200 for 60 responses which I though was crazy. I ended up asking classmates and they all said to use google forms instead which was relieving to hear but also a bit disappointing knowing I wasted a whole class. It only took 45mins to make the forms survey and send it out which was also good.

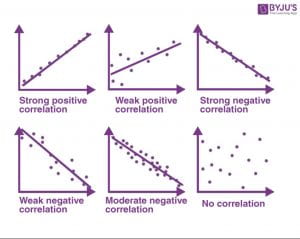
I sent it out by putting a link in learner central and letting whoever’s in PLP do it if they please. That was also a bit risky knowing that absolutely nobody could do the survey, but over the weekend we did end up getting 14 different responses for each question. By the time people did our survey Sepaus was back from York and we were ready to make out graphs. I got to give him props for making pretty much the whole slideshow so it evened out with work ethic. We thought only having 14 responses we may not have a correlation graph, but it turns out our questions were really good and got a somewhat strong correlation. You can see our original questions in the picture that I attached, and the two sets that had to most correlation were questions 1 and 2 (How many times you go to the theatre in a year?, and on a scale from 1-10 how exited are you for Shrek 5? Turns out that one has a weak positive correlation and even a little causation so it being the more you go to the movie theatre in a year, the more you may be interested in new movies coming out in the future. Our second correlation was definitely a stronger one but in fact had no causation to it. They were questions 5 and 6 (Rate froot loops from 1-10, and on a scale from 1-10 how much do you like to wear colourful clothing to school?) That one had more of a strong positive correlation than the last one but no causation. The conclusion we had for that one is if you wear colourful things to school you also like colourful foods like froot loops. That’s basically what we said in our presentation so I wont have to show anything else from that but yea. Thanks for taking the time to listen to how we made our project, and if you want you can still do the survey for fun but your results really wont matter. Some core competencies are down below and this is the survey link:Survey Here!
Planning and Conducting:
I think we did this competency pretty well even though we had a hard time finding questions which actually correlated. Me and Sepaus always had the same 10 questions but had to reword them so we could get results in numbers. I think if we wanted to extend on this even more we could have tried to find more correlations, but we found 2 and both were positive correlations. Even better 1 was a causation as you saw.
Communicating and Representing:
In our slideshow we showed images and examples helping the audience understand what exactly our specific correlations were and how our causation actually worked. Because we did this and dove deep on it I think we did a decent job. We would have added more pictures of our survey and how we asked the questions, because I thought that would’ve been great if the audience experienced it first hand.
Applying and Innovating:
Me and Sepaus used all of our class time to do the needed work and to work ahead with our extra time. Him only being in class for about 3 days during this project I got to give massive props to him for working hard while he could and making the entire slideshow in one class. By doing this we ended up with a great presentation that accomplished the expectations. We also worked together to get through some challenges that we ran into throughout this project like the New York trip and the google surveys issue which shows our work ethic.