Contents
What Was This Project❓
This project was lots of fun and very interesting. The driving question we had for this project was “What did European settlement mean for all the people involved?”. For this post I will take you through the most important parts of this project in my opinion. The end result of this project was to create an infographic that answered the driving question and I think that mine looked pretty good.
Some Things We Did 📝
Trade Simulation Game 🦫
One of the things we did early on in the project was a trade simulation game. I found this to be very helpful in understanding how the trade worked a bit better and it was a lot of fun (probably the best part of the project). For this game you were either in a First Nations tribe or one of the companies they traded with. The goal of the game for the First Nations was to get rid of all their beaver pelts and get lots of resources by trading and the goal for the companies was to sell their resources to get beaver pelts. There were also different rounds where there were changes like we couldn’t talk while making a trade.
Milestone 2: Continuity and Change Sheet ✅
For this milestone we were given different topics and we had to fill out a sheet about how they were either a change or continuity. For example one of the changes was “Conflict and War” so you then had to take that and answer the question for each box. You can see my finished sheet below. This was a very helpful milestone for learning how to identify continuity and change, which is an important skill for this project.

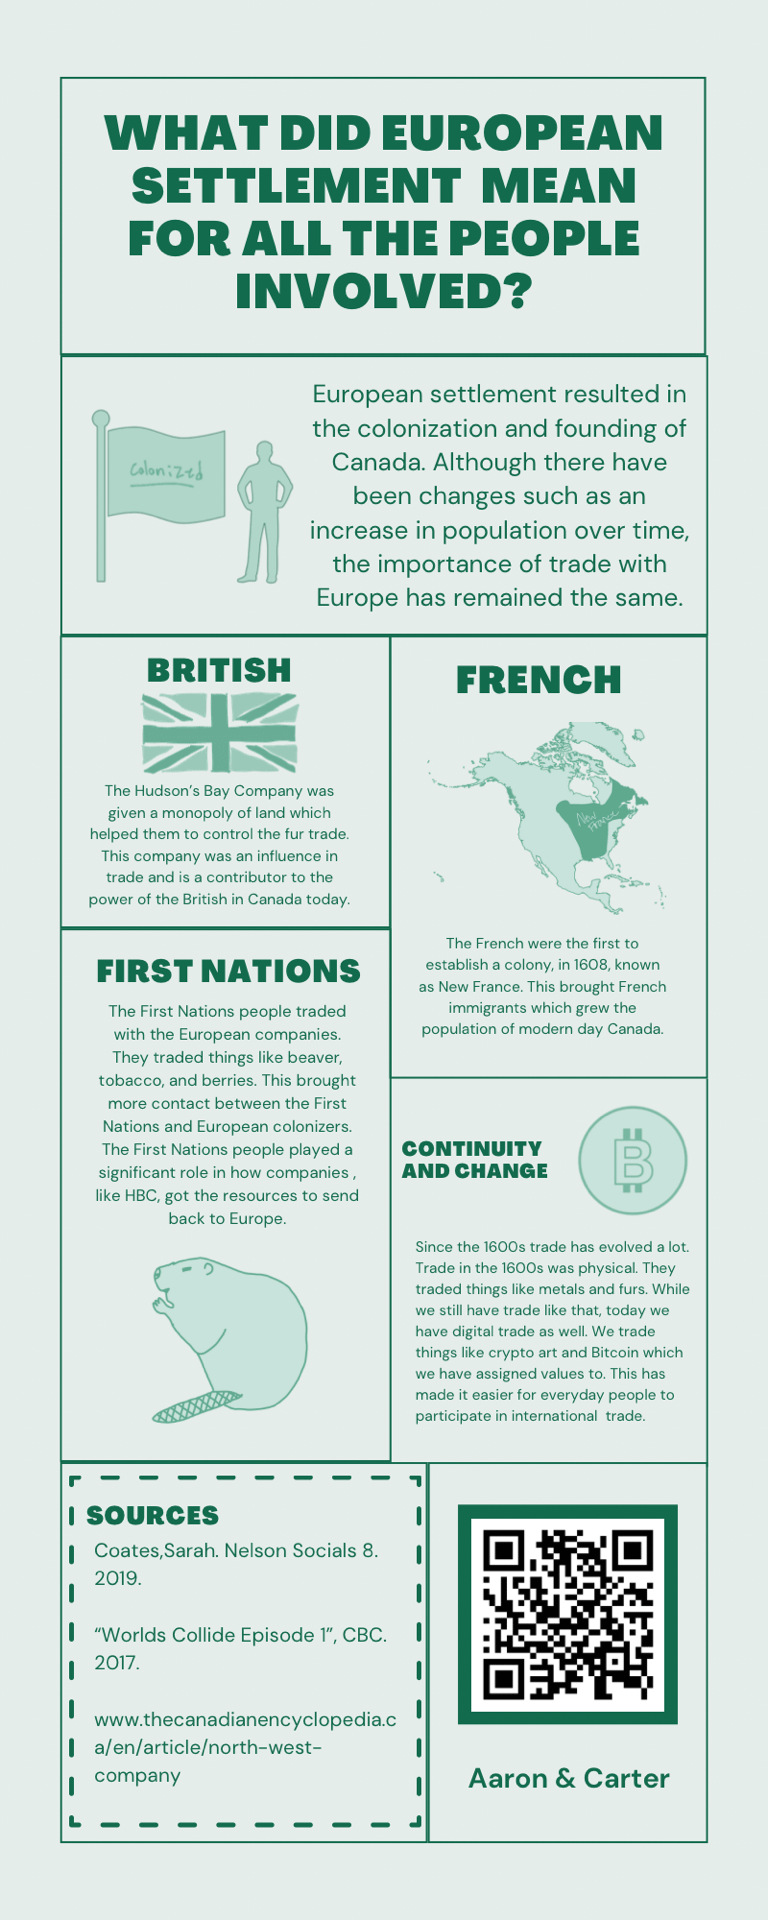
Milestone 4: Infographic ✅
The end result of this project was an infographic that answered the driving question by explaining what European settlement meant for all the people involved. For this infographic we were given a template which we used as a starting point for our graphic. Each group got one of five options. My partner and I were given a one with a green theme. The Infographics had to include a thesis statement, 3 facts (1 about each group), a continuity and change statement, sources, and graphics to go along with each of those. You can see my infographic and the base template we were give below.
An Area I Struggled 😬
The part I struggled with the most through this project was a notes template that we were given to use along the project. I didn’t like using this because I don’t like using templates for note taking, I didn’t like how it was formatted, and I found working with the text boxes difficult as I prefer to do hand written notes. I know you can do that in pages but I don’t like how the drawing feature works or feels in pages. You can look at my notes template below.

Final Thoughts 🧠
If you are still wondering how we answered the driving question I’ll quickly explain. We answered the driving question in our research throughout this project. We listened to multiple lectures and explored different websites and articles from different sources. We also showed our newly gained knowledge by creating the Infographics which answered the driving question.
Overall a fun project where I learned lots of new things in an interesting area while also getting to create a nice looking infographic. Thanks for reading this post and I hope to see you next time!
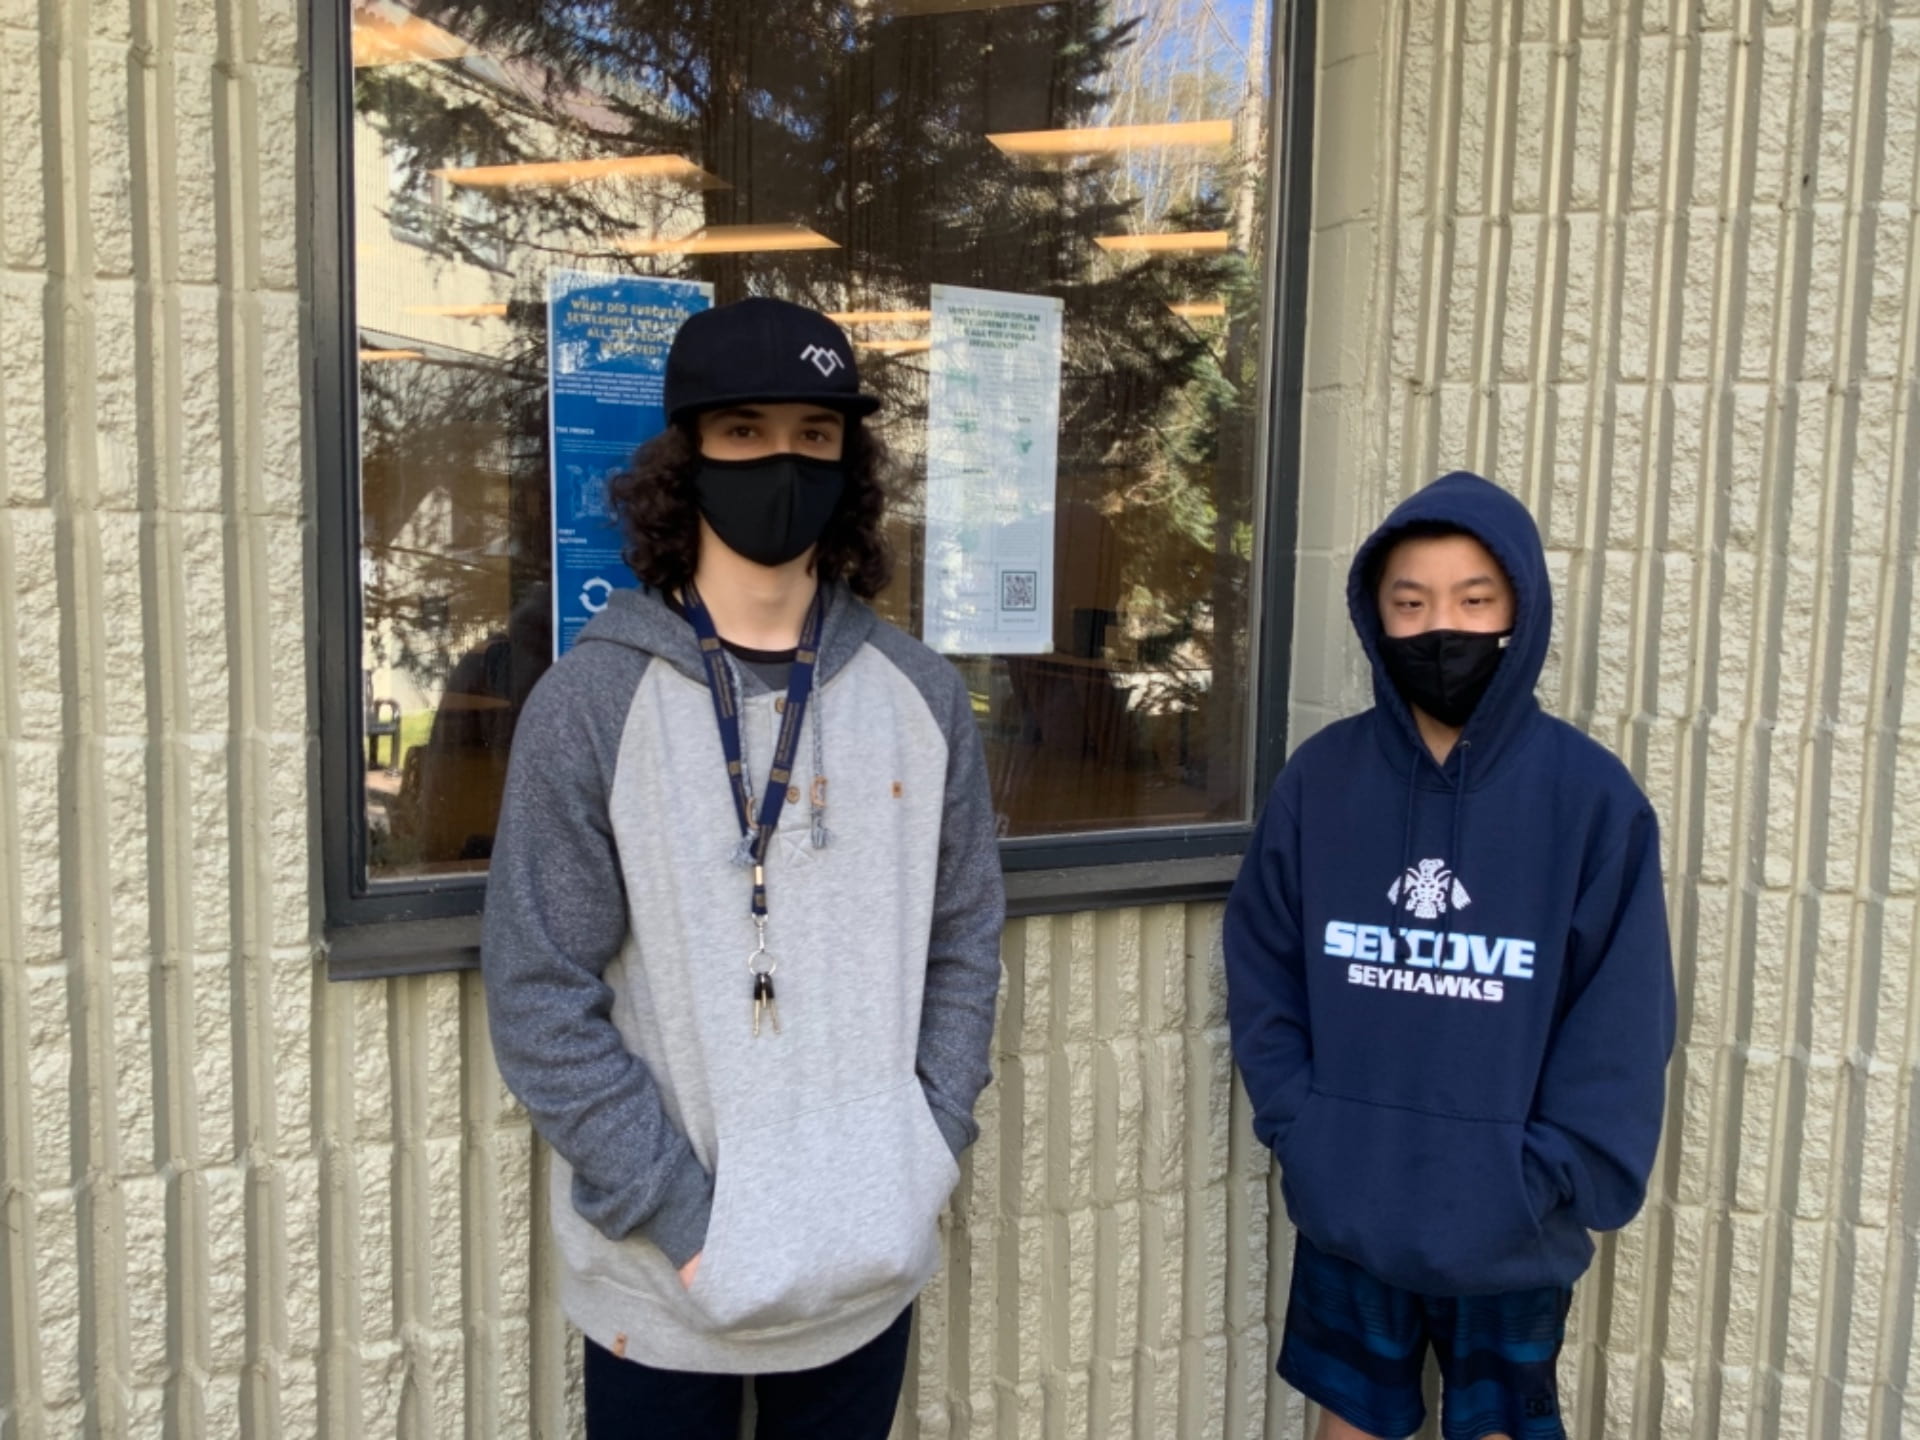
Us With Our Infographic
Be First to Comment