Hi everyone, today I’ll be writing about the project I just finished in PLP 8.
This project was based around European settlement and also the First Nations. Another aspect that we learned about in this project is “Continuity and Change”. This is our final project of Humanities In PLP 8!
In this project we worked in groups to create our final product. The final product in this project was an Infographic.
The driving question in this project was “What did European Settlement mean for all the people involved?”
My answer to that is that it effected trade for all those involved. For example, the Europeans received resources to make hats and different fashion, and the First Nations received new foods and modern tools and weapons.
To demonstrate my learning, I will be highlighting the milestones/stepping stones that helped me reach an answer to the driving question.
The first thing I will be highlighting is the history of settlement and how it effected each side.
During this project we had a pages notes document that we regularly updated with information about settlement as a whole. We learned about treaties, relations between different sides, importance of land, and colonization. This info was important because it was a key part of our Infographic. This information was the evidence that supported our thesis on the Infographic.
I found it interesting to learn about First Nations because where I live there seems to be a presence of First Nations culture. Furthermore, this info extends my thinking on previous knowledge that I obtained in elementary school.
The second thing that helped me answer the driving question was the Survival Challenge activity that we did. This helped because it gave me an idea of what is needed to survive in the wild. To do this, we created a video demonstrating a survival technique of our choice.
I did this activity with my partner, Samuel and we chose to demonstrate an SOS signal.
Here’s our Survival video!
This video was really fun to make and I would be open to something like this again!
The next milestone I will be mentioning is milestone 4.
Milestone 4 was our Infographic about European Settlement.
To prepare for this milestone, we learned about what made a good Infographic. I learned that Infographics must be short and sweet an they also must tell a story.
Also, we brought various drafts and received peer critique.
Here’s my first draft:
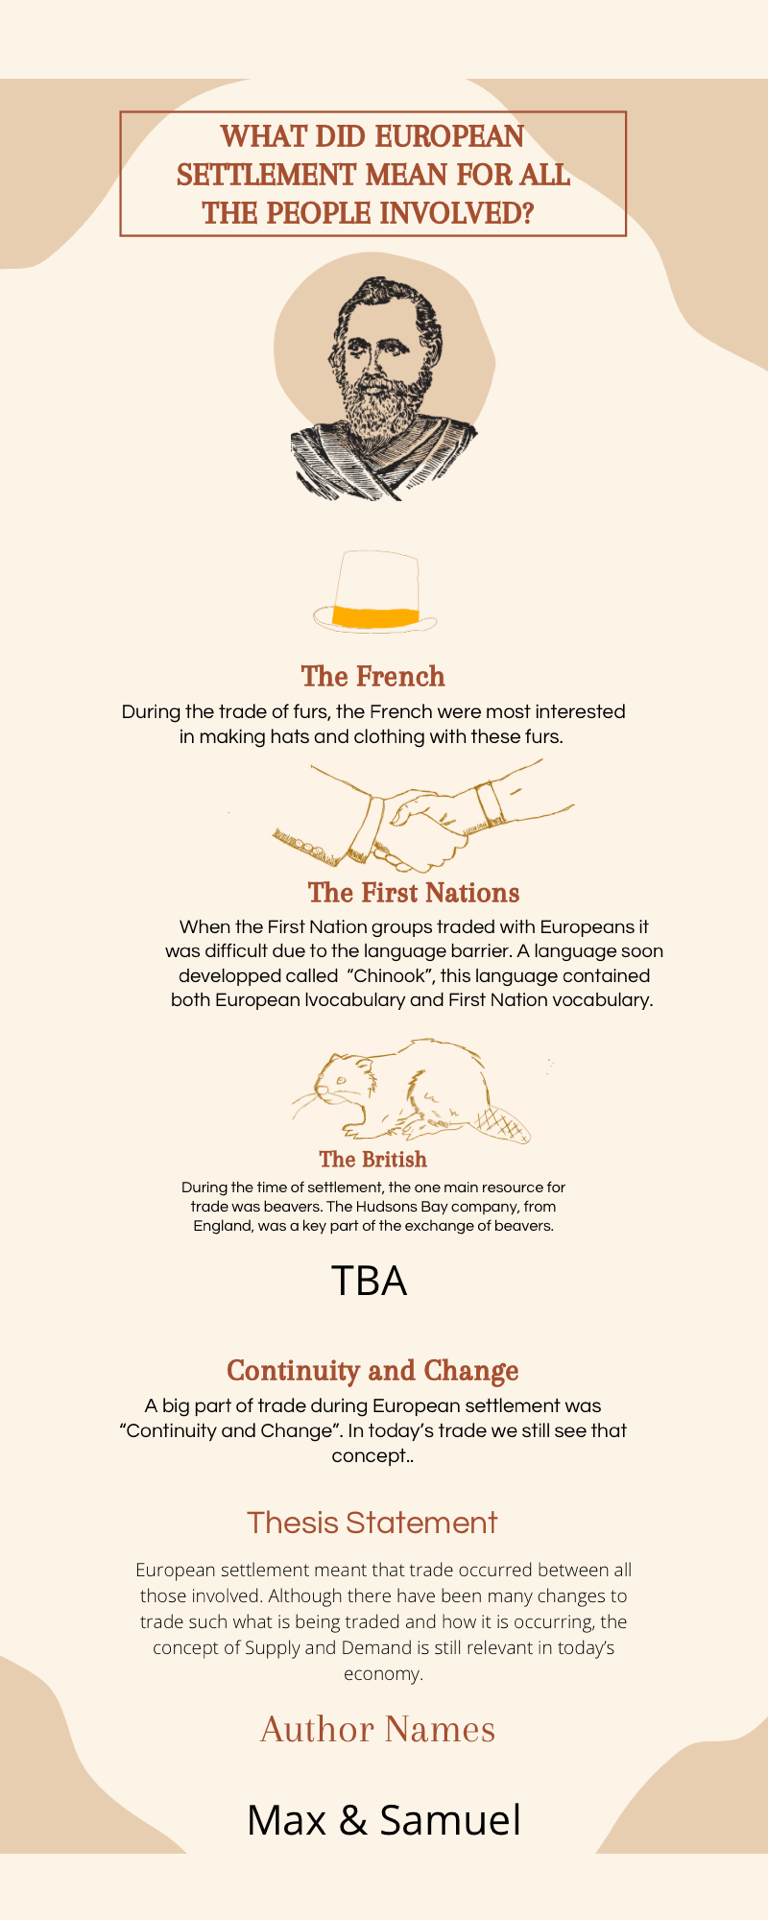
The critique that I got was to change the colour of the hat, find credible sources, and center images and text better.
My partner and I took this feedback and started fixing our mistakes.
Now here’s our final draft!
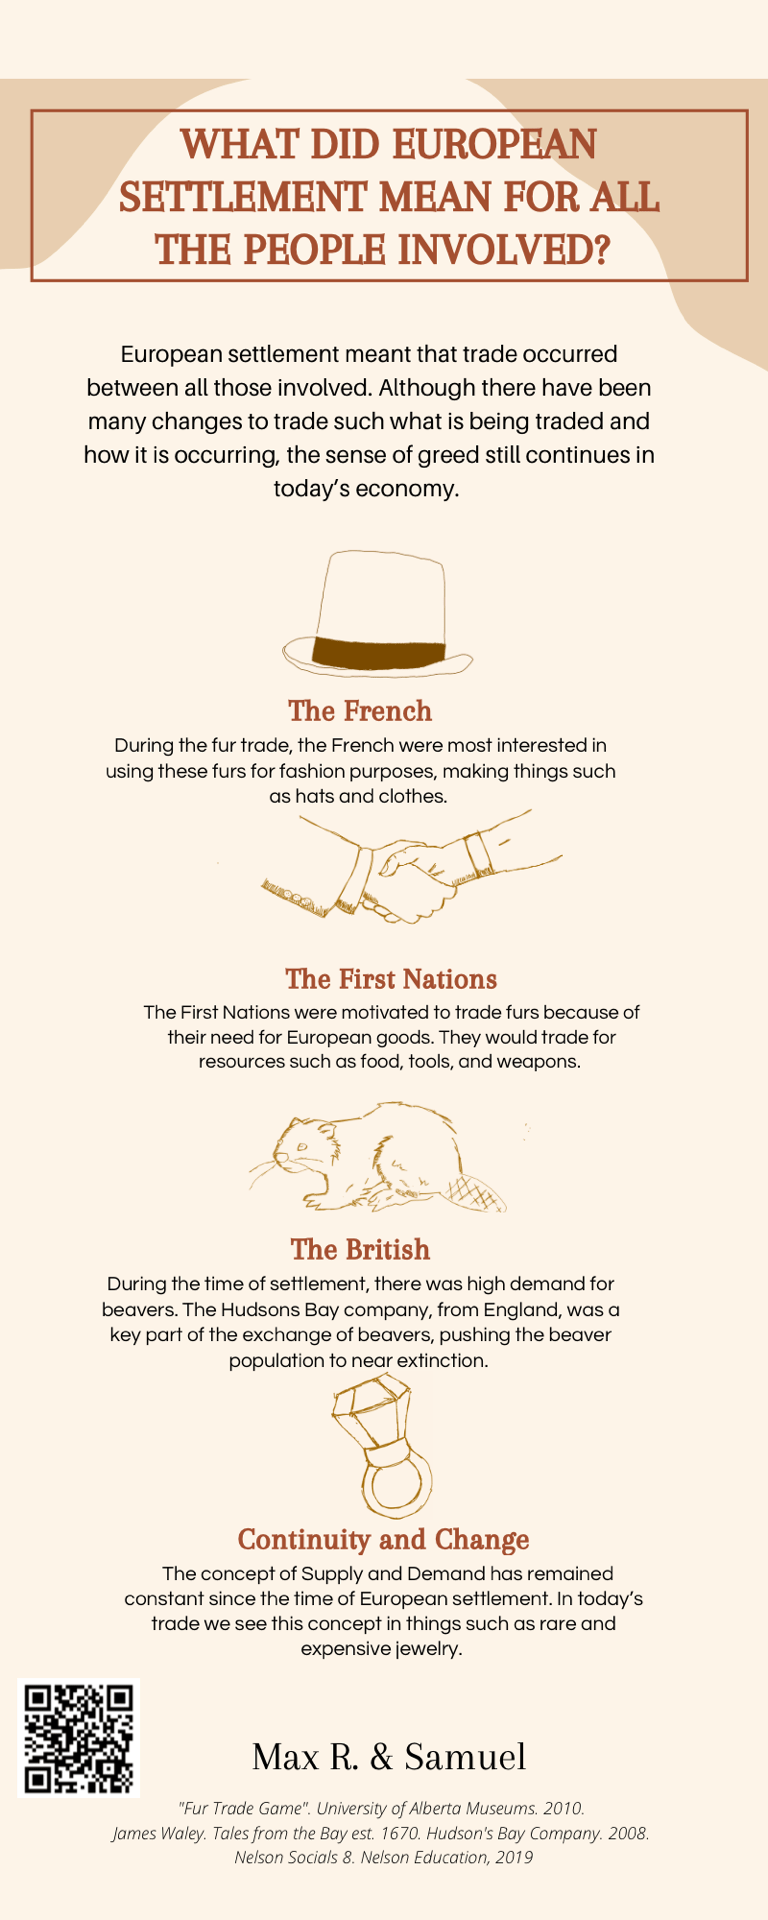
To make the Infographic better we changed some of the info so that it resounded more with the thesis. We also centred the text and images better.
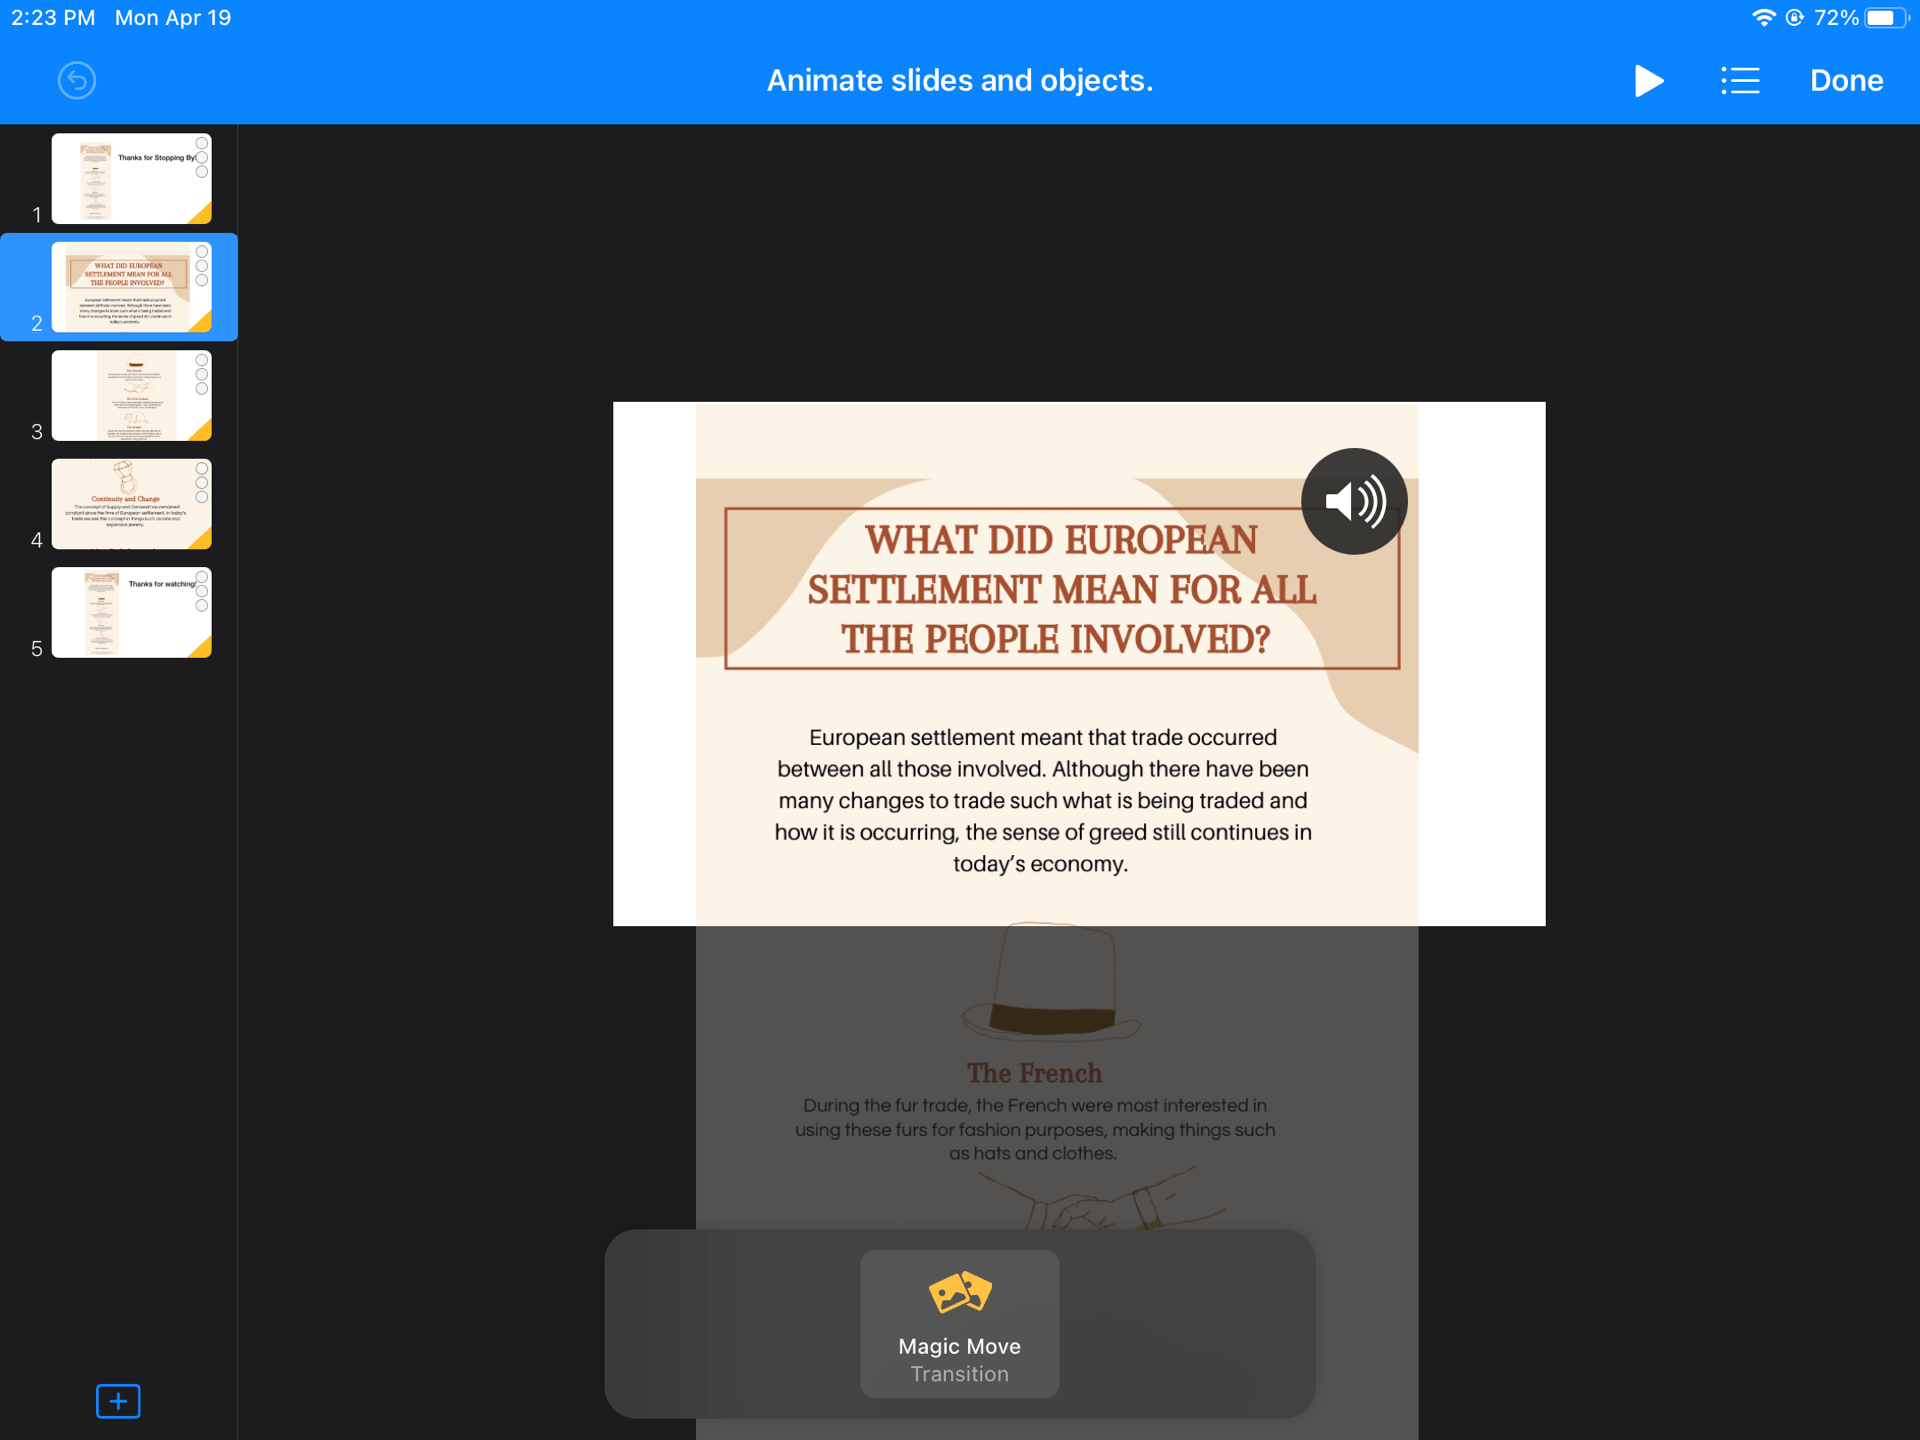
Now the Infographic wasn’t the final piece, to give the viewers of our Infographic a better idea of what settlement meant, we created a video that explained it.
To create this video, we used the Keynote feature “Magic Move”. This was my first time using it, so it was a quite learning experience!
To watch our Infographic explainer video go to the top of the post!

Every project in PLP is guided by the “Curricular Competencies”.
This project had only 2 competencies, Using Evidence, and Identifying Continuity and Change.
For Using Evidence, I think at first I wasn’t that advanced, however now I think I have improved those skills. I learned to show that growth by practicing on finding credible sources and using evidence that relates to what I’m implying.
And for Identifying Continuity and Change, at first I had no idea what Continuity and Change was. And now I fully understand what it is and how to apply it. I learned to show this by doing milestone 2 and by writing a Continuity and Change statement for my Infographic.
In Conclusion, I found learning about settlement and the First Nations especially really interesting. It was also good to work on Group work, something that you will regularly see in PLP. Furthermore, it was cool to make an Infographic as our final product.
Here’s a picture of my partner and I by our sign!
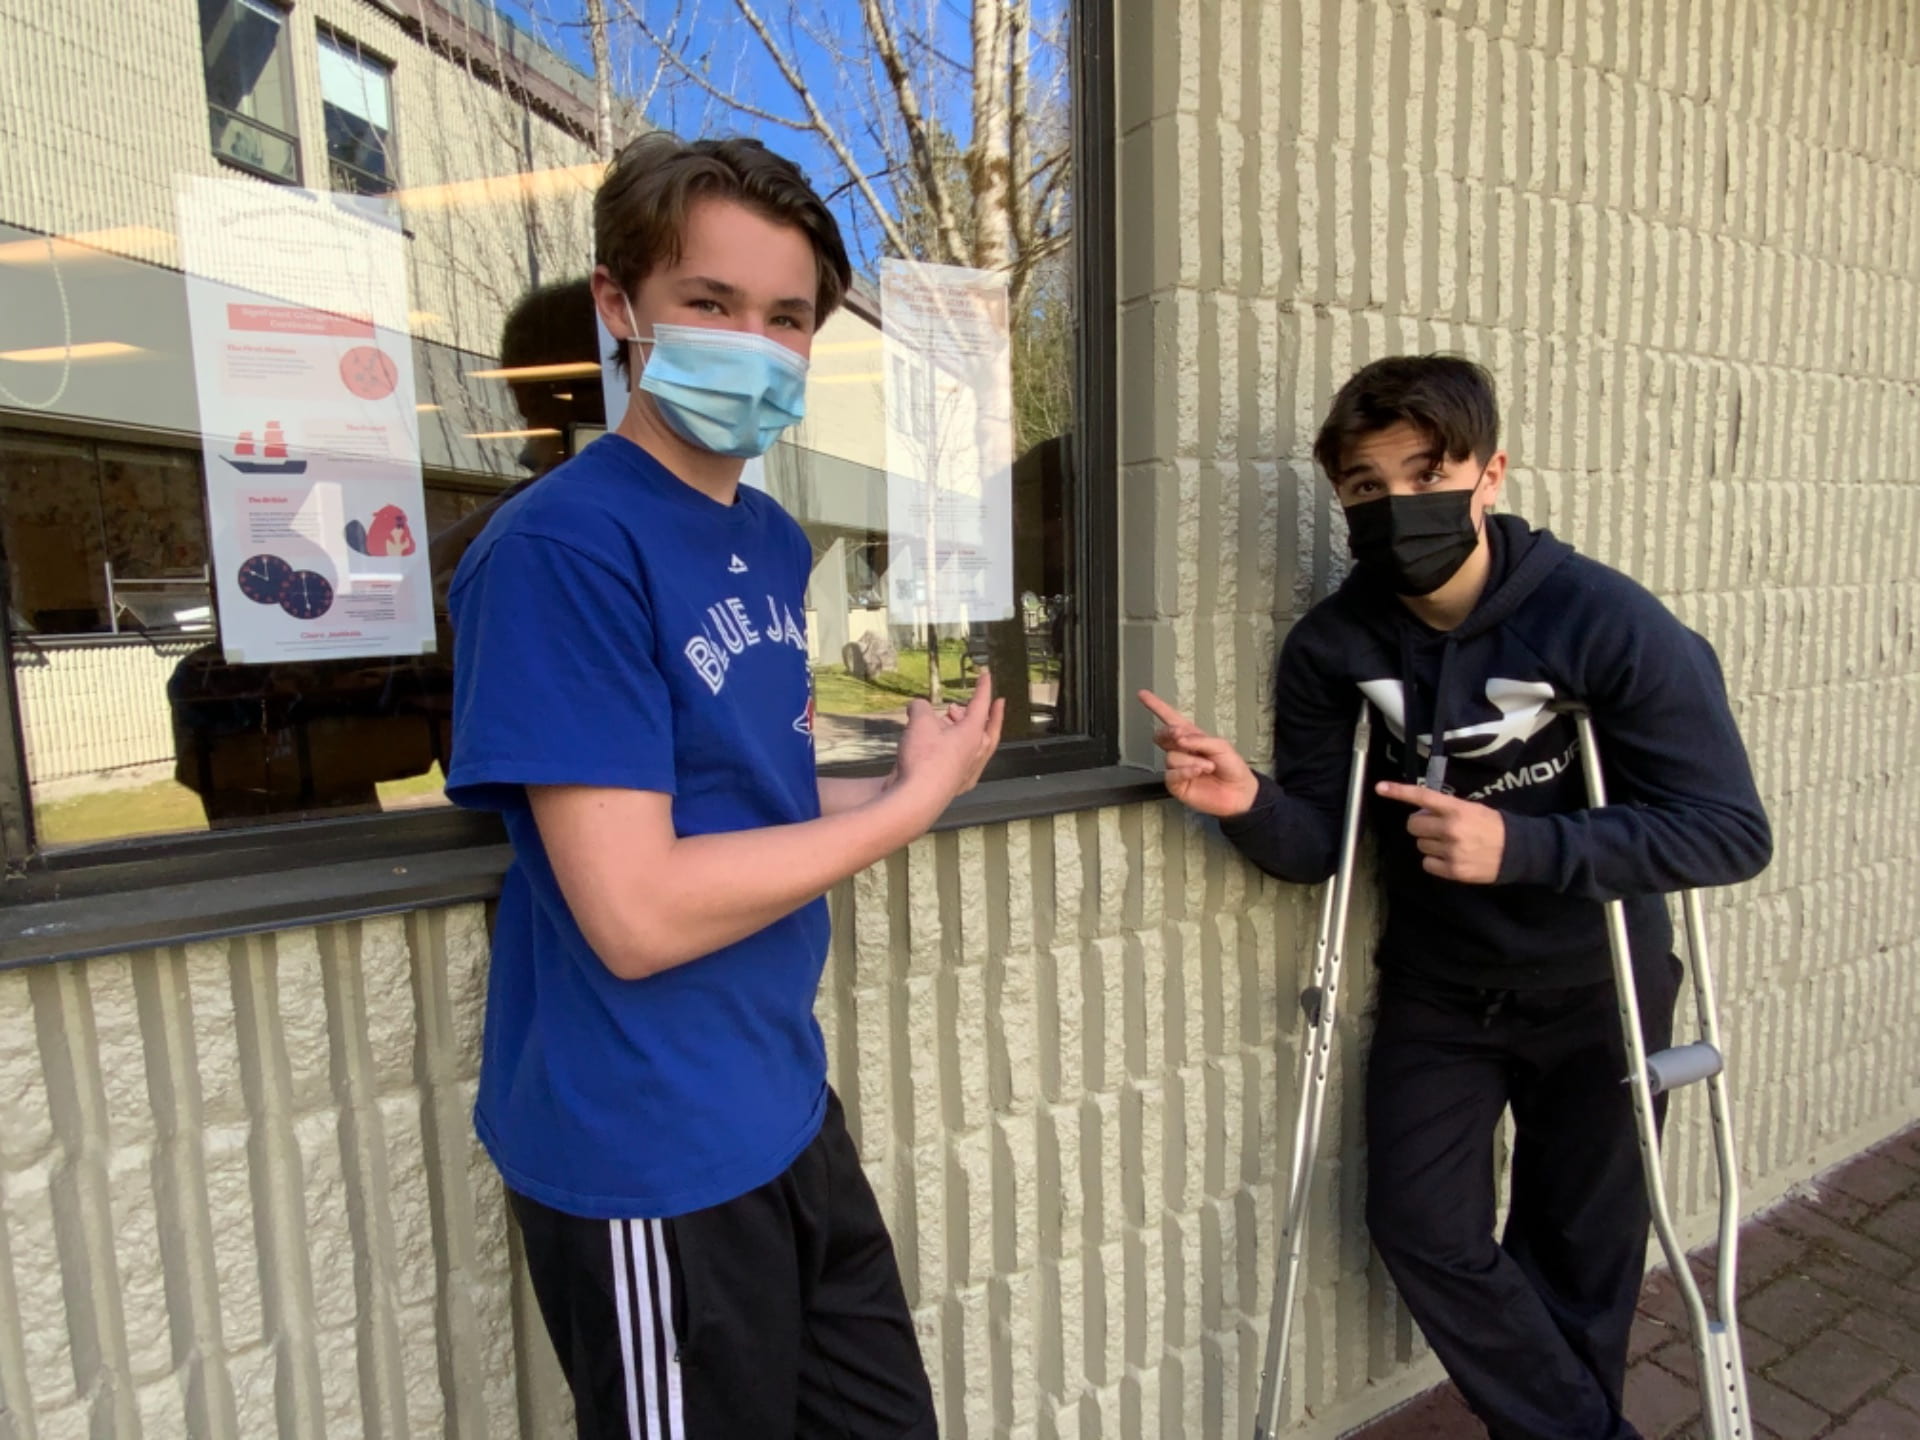
Thanks for reading!