Hello once again!
We are now in the second quarter of our 2020- 2021 school year. And with a new quarter comes new classes, this time I have scimatics with Mr Gross.
The very first project that we got was called “Fractions of your Time” and was all about fractions and screen Time.
There were 3 curricular competencies in this project.
The first one was Applying and Innovating: “Contribute to care for self, others, community, and world through individual or collaborative” This competency was the easiest of the three. All you had to do was pay attention in class and not distract others. I did this by explaining the questions that my table parter didn’t understand. I also worked well and leaded our group in milestone one, and a small group challenge at the start of class.

The second competency was Understanding and Solving: “Visualize to explore mathematical concepts.” For this one we had to record our screen time and put it into a table. Recording the screen time wasn’t the hardest. Since I spend most of my time on the iPad, I could just go into settings and see how much screen time I had. For the times when I wasn’t on my iPad, I tracked when I got on, and when I got off the screen. Then just a bit of math to find out how much time I was on a screen. We also had to record a few other things that we would like to track. I decided to track, time spent sleeping, time spent in a car, and time spent rock climbing. I also colour coded my table to make it easier to read and translate into charts
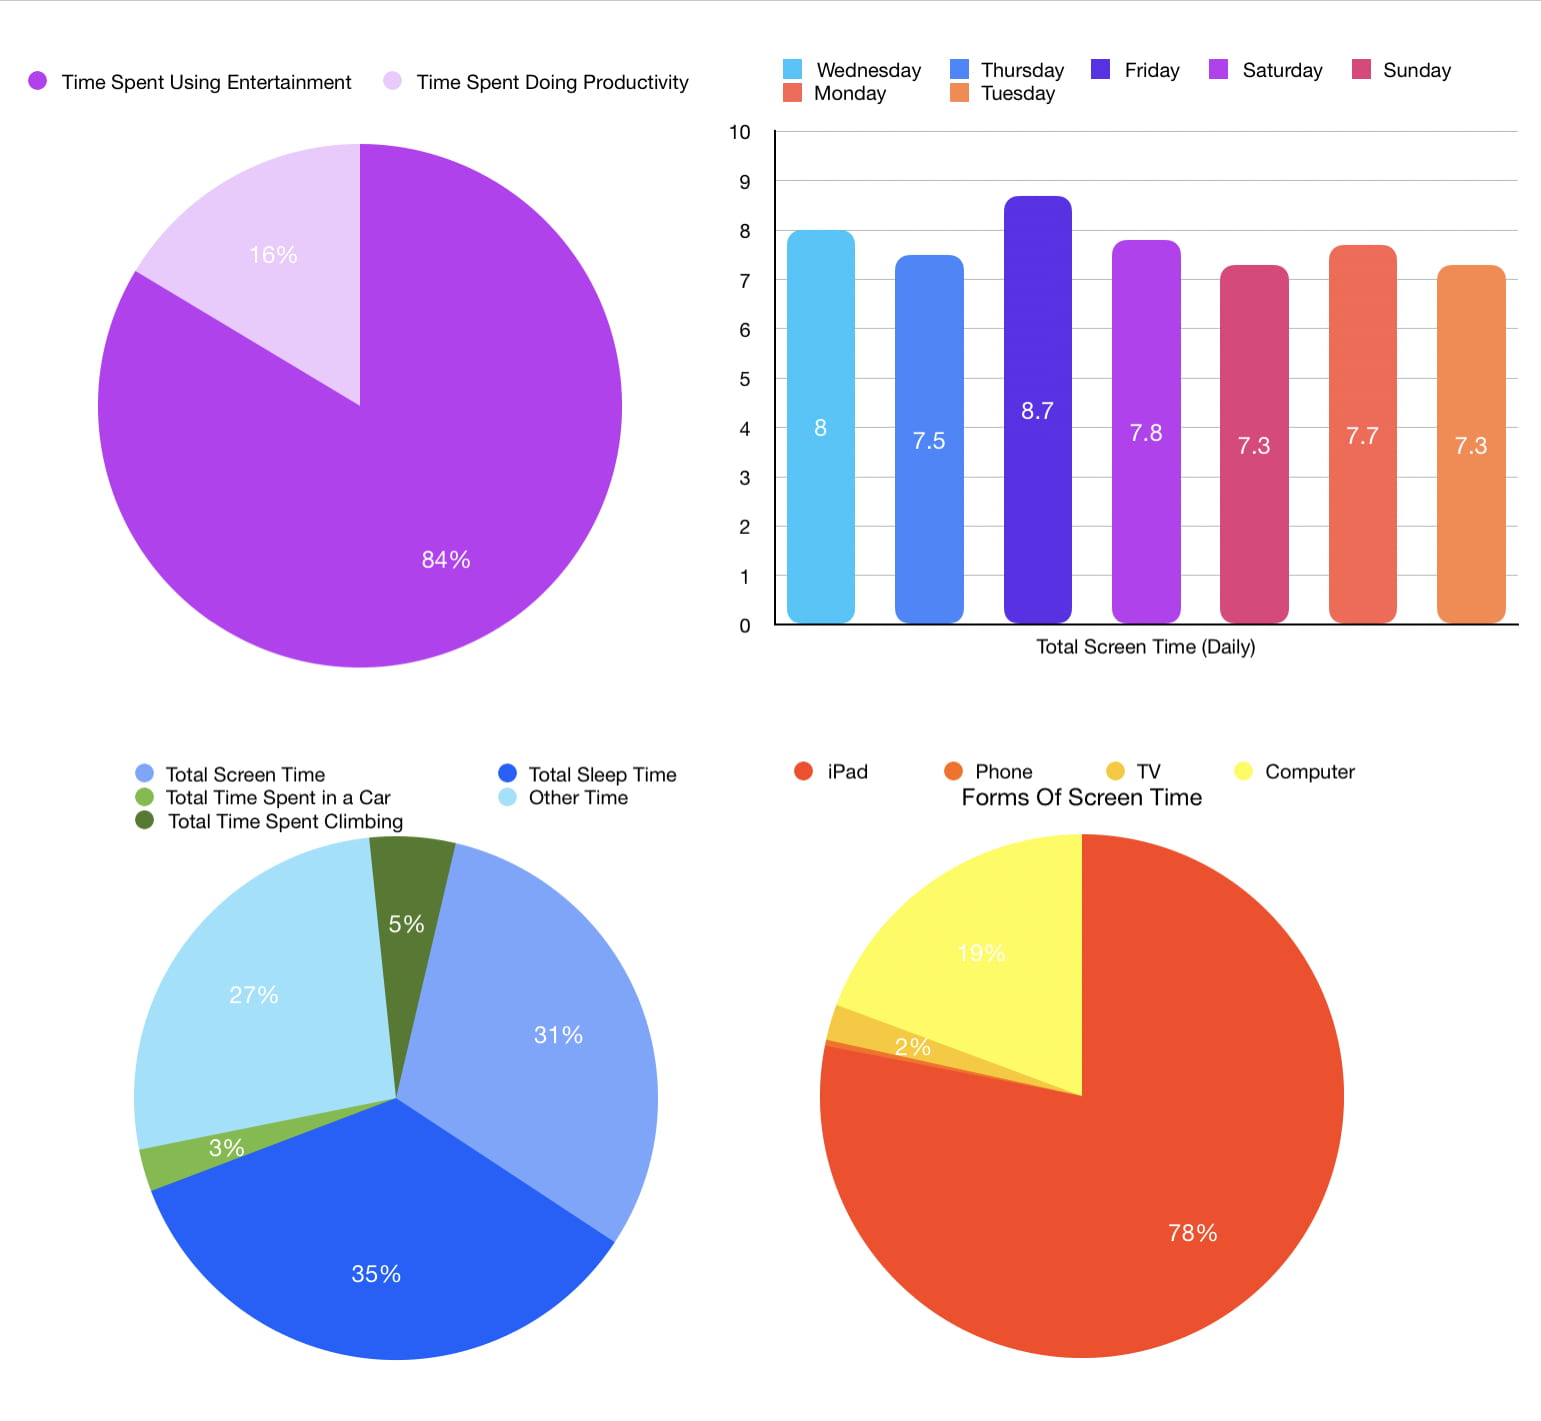
The final competency was Communicating and representing: “Represent Mathematical ideas in concrete, pictorial and symbolic forms.” For this I represented my mathematical ideas in pictorial form, otherwise know as charts. I made four different charts, three pie charts and one bar graph. Each chart showed an interesting percentage that I tracked in my chart. To round out the project, we did a super quick presentation showing off our charts and tables to the class.
Finally for the driving question, this project’s driving question was very simple. “What fraction of our time is screen time.” After this project I can pretty confidently confirm that screen time takes up around 1/3 of my week. Now I know that’s a lot of screen time, it converts into around 7 hours per day, and I should probably go outside more. However, to be honest, it could have been a lot worse.
Thanks for reading this short summative post. Now would you excuse me, I’m going to get some fresh air.