
My first scimatics project is done! This project was very intriguing and informative because you got to fully realize just how much of your time is screen time. I also got to see how much of my time in a week I am exercising and reading.
For this project we used the screen time function in settings and recorded our amounts in numbers. Then, depending on what extra topics you did (mine were exercise and reading) you recorded those extra topics in the numbers document as well. To record my reading I used a stopwatch on my phone from the time I started reading to the time I ended. To record my exercise I also used a stopwatch for when I went for walks and I already knew how much time I did indoor exercise because it is mostly dance.
What fraction of our time is screen time?
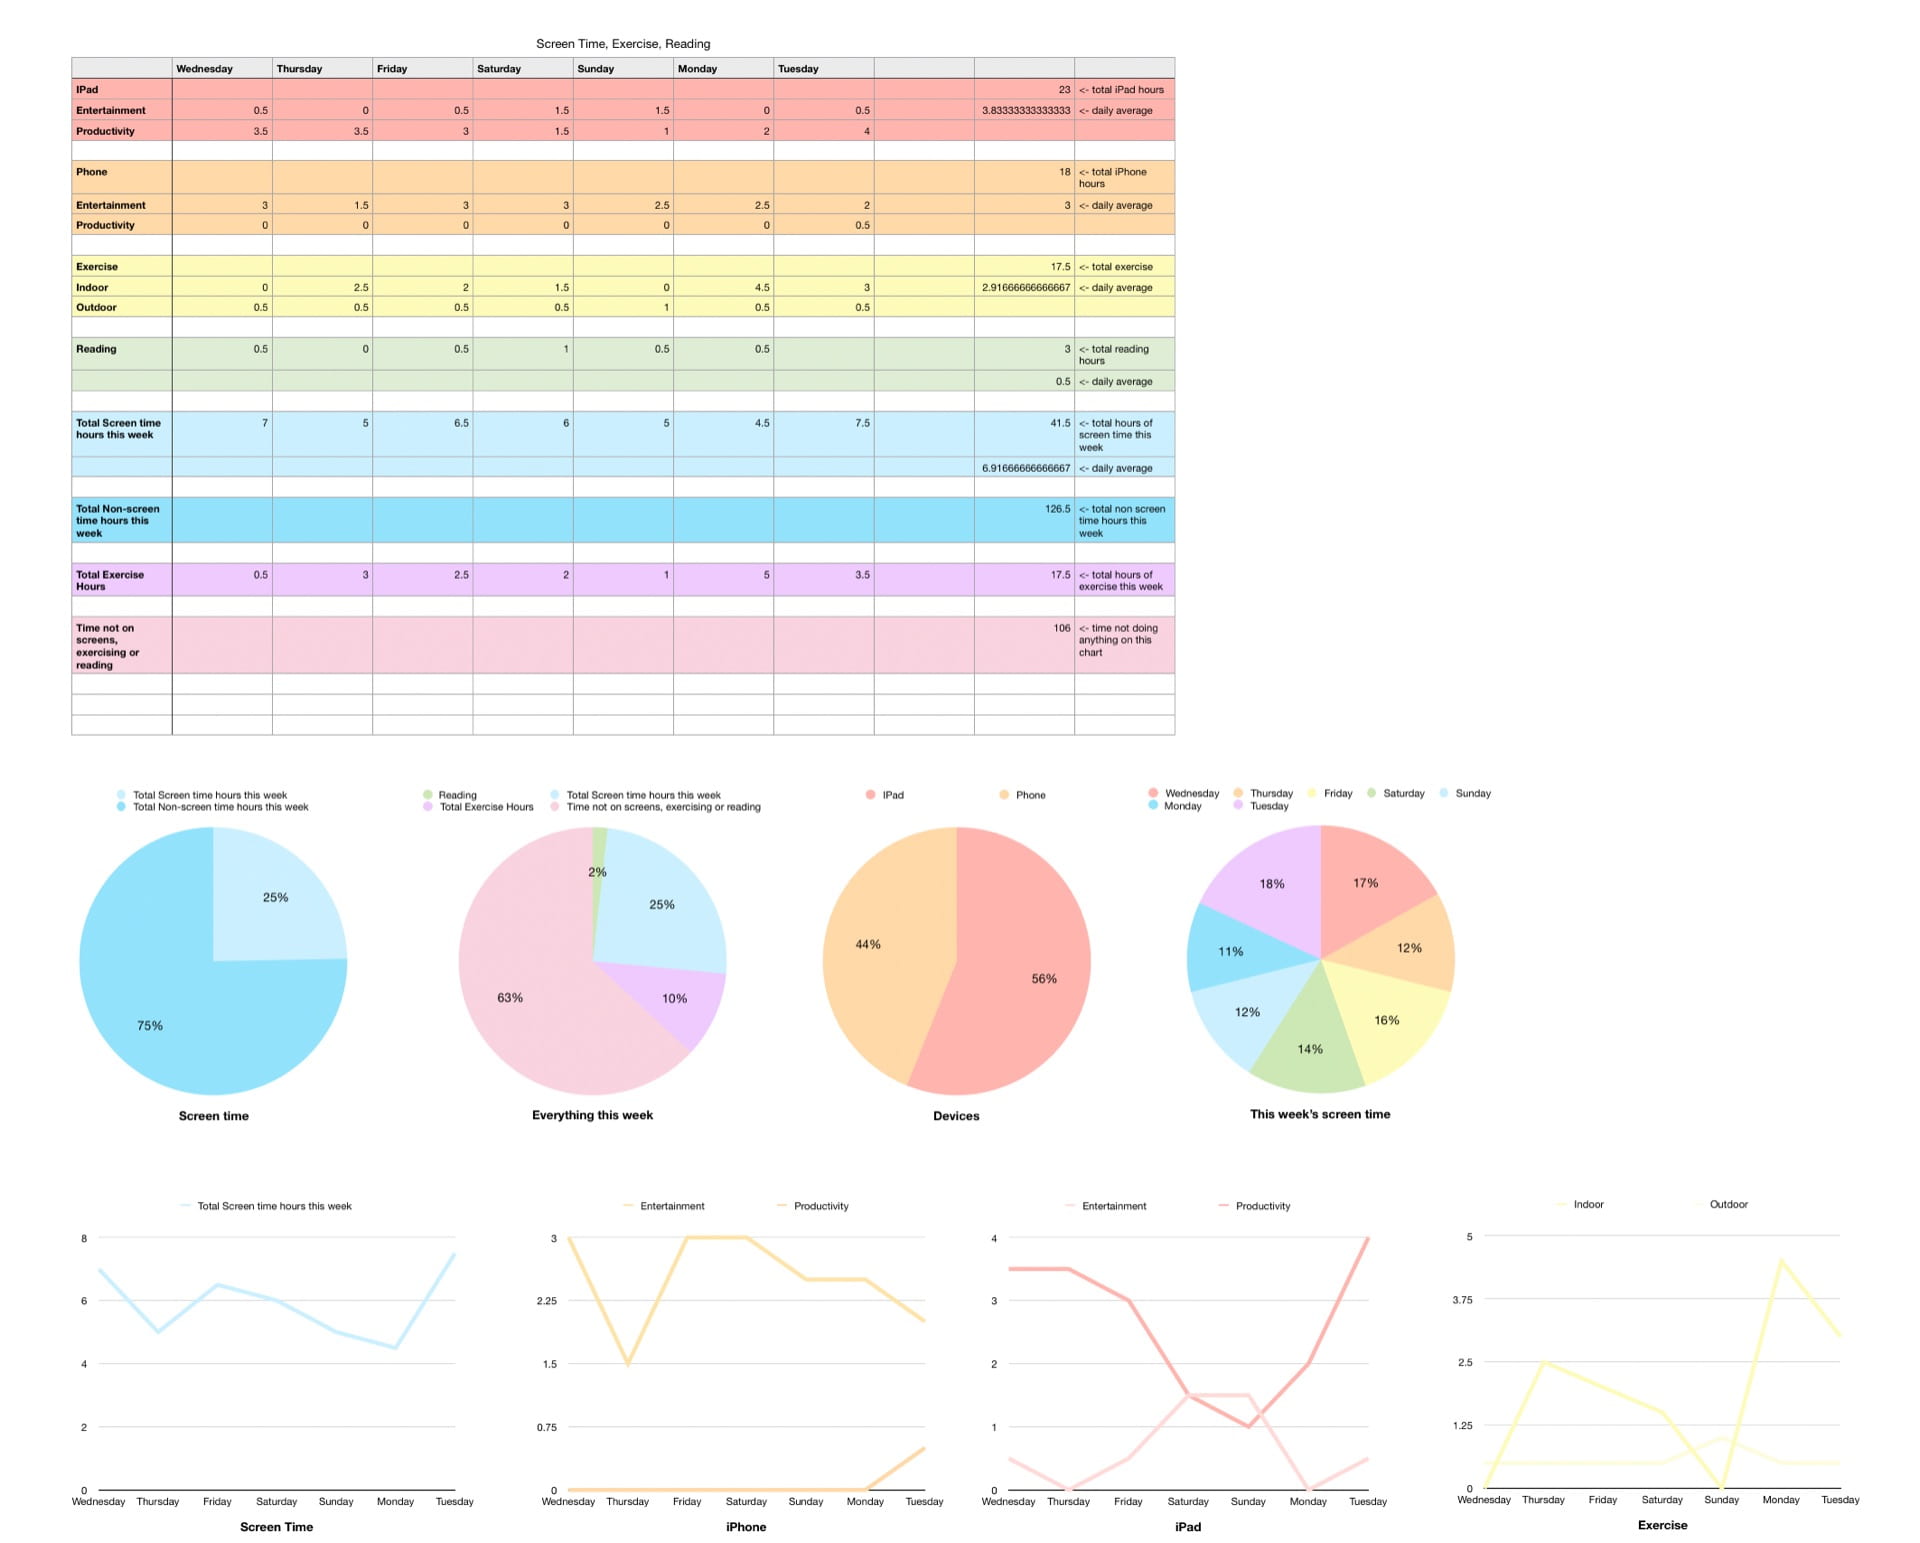
Through this project I found out that 1/4 of my time in a week is screen time. My daily average for screen time is about 5 hours 30 minutes. That includes everything from watching Netflix to doing homework. 1/4 isn’t super surprising and, being honest, its better than having 2/4 of your time. I would say that my screen time amount is regular to small for a teenager. I am okay with having 1/4 of my week be screen time. I also found out that 1/10 of my time in a week I am exercising, which I am proud of. My daily average for exercise is about 3 hours.
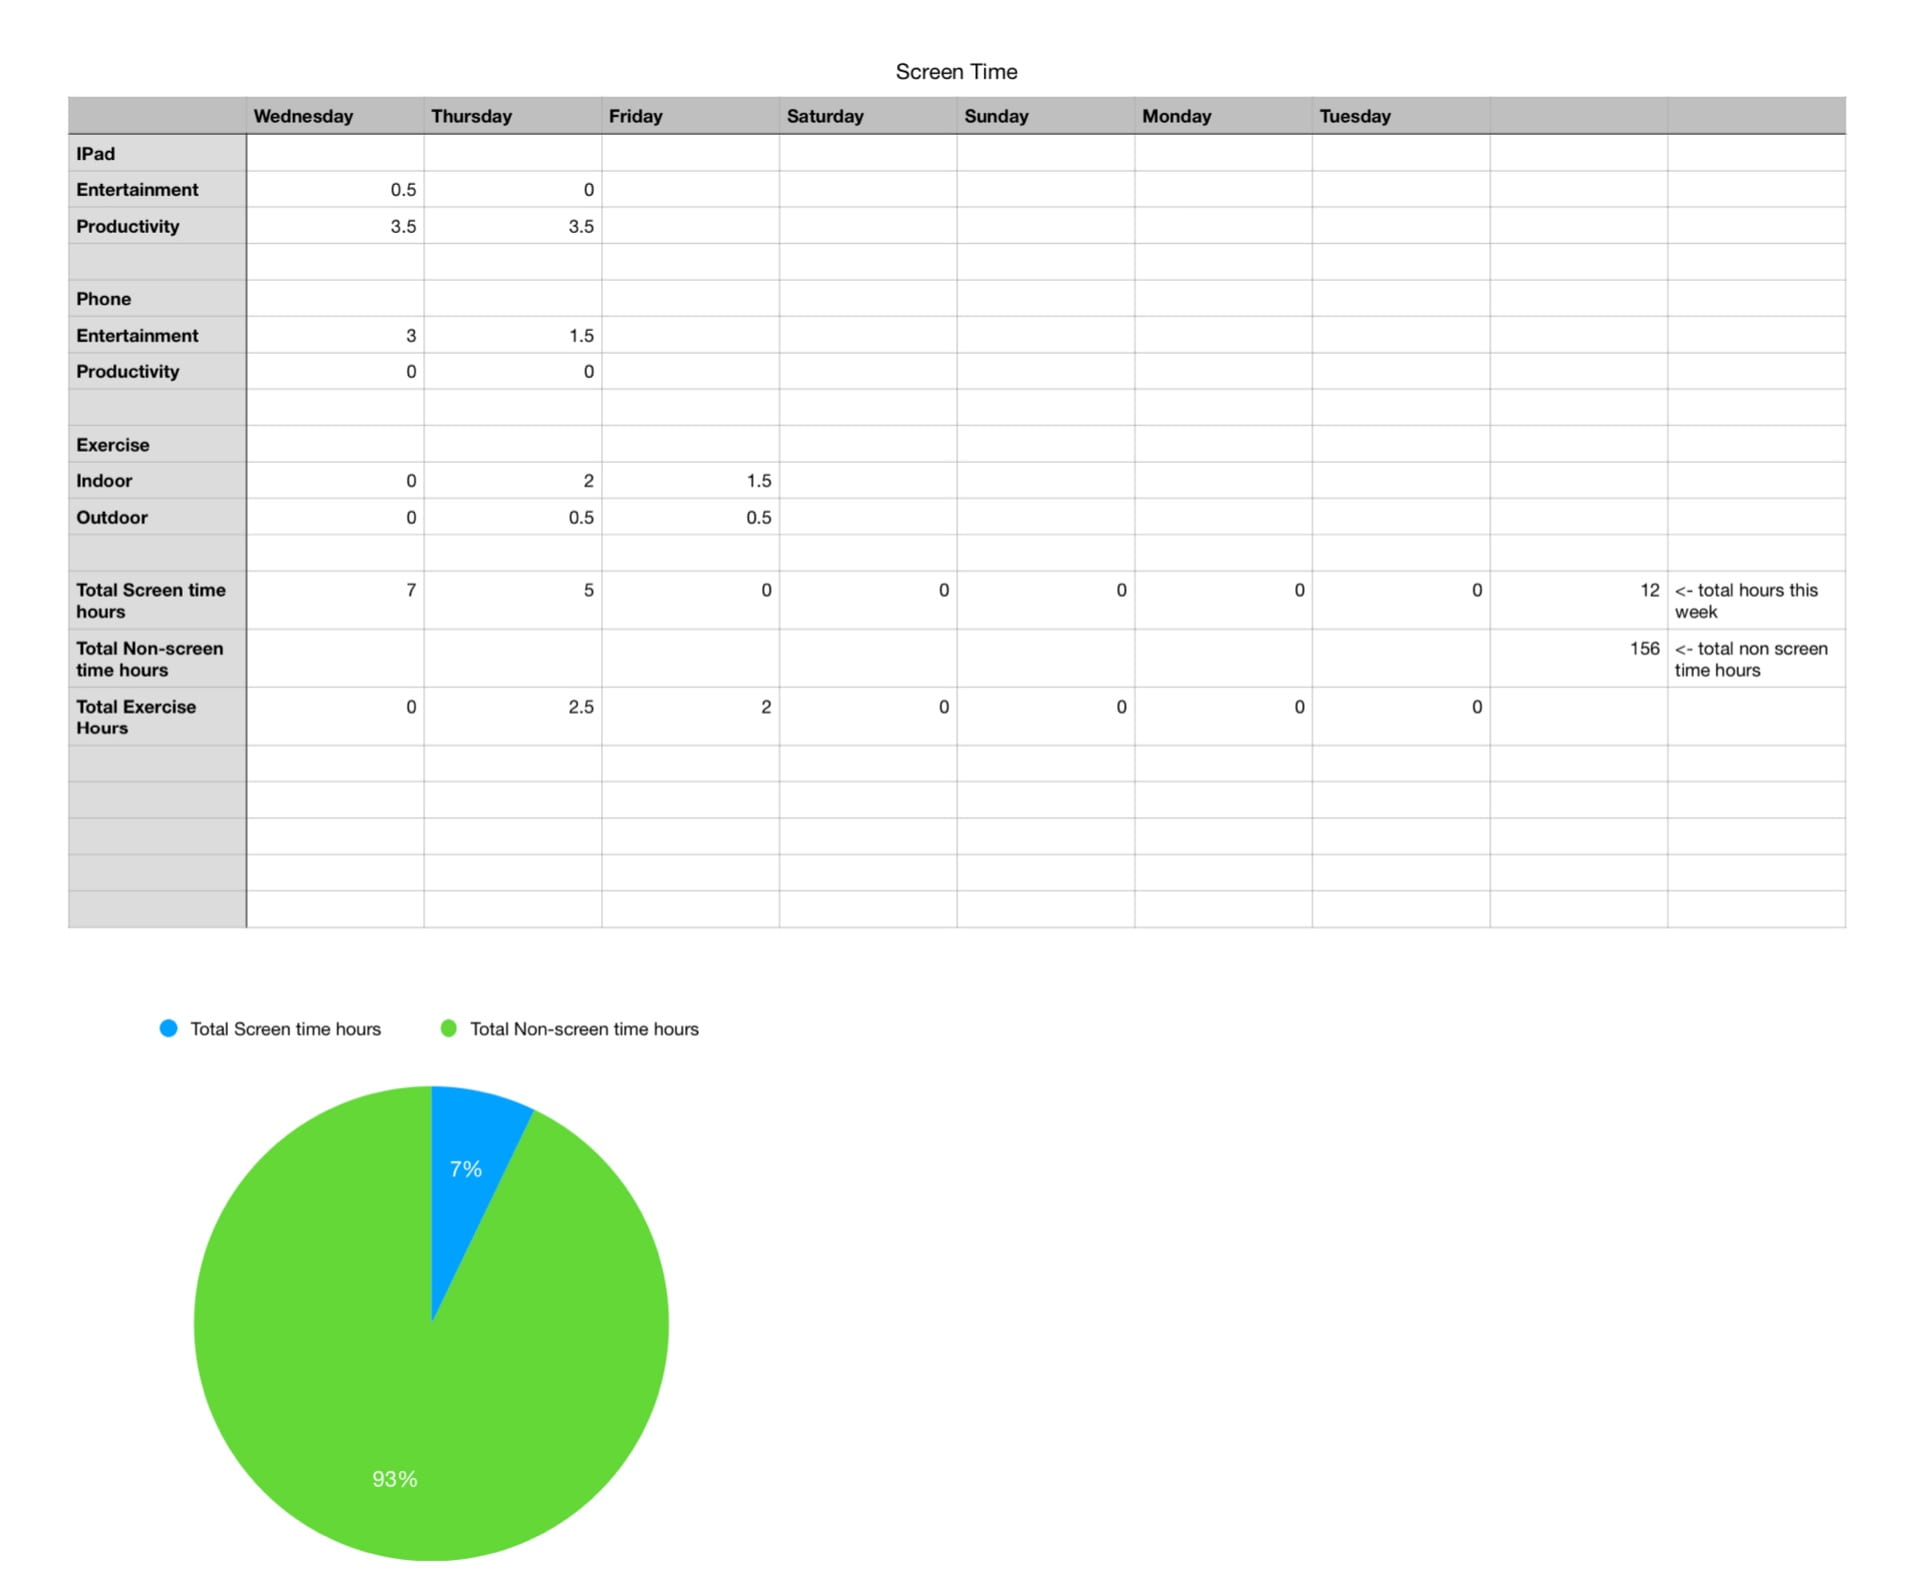
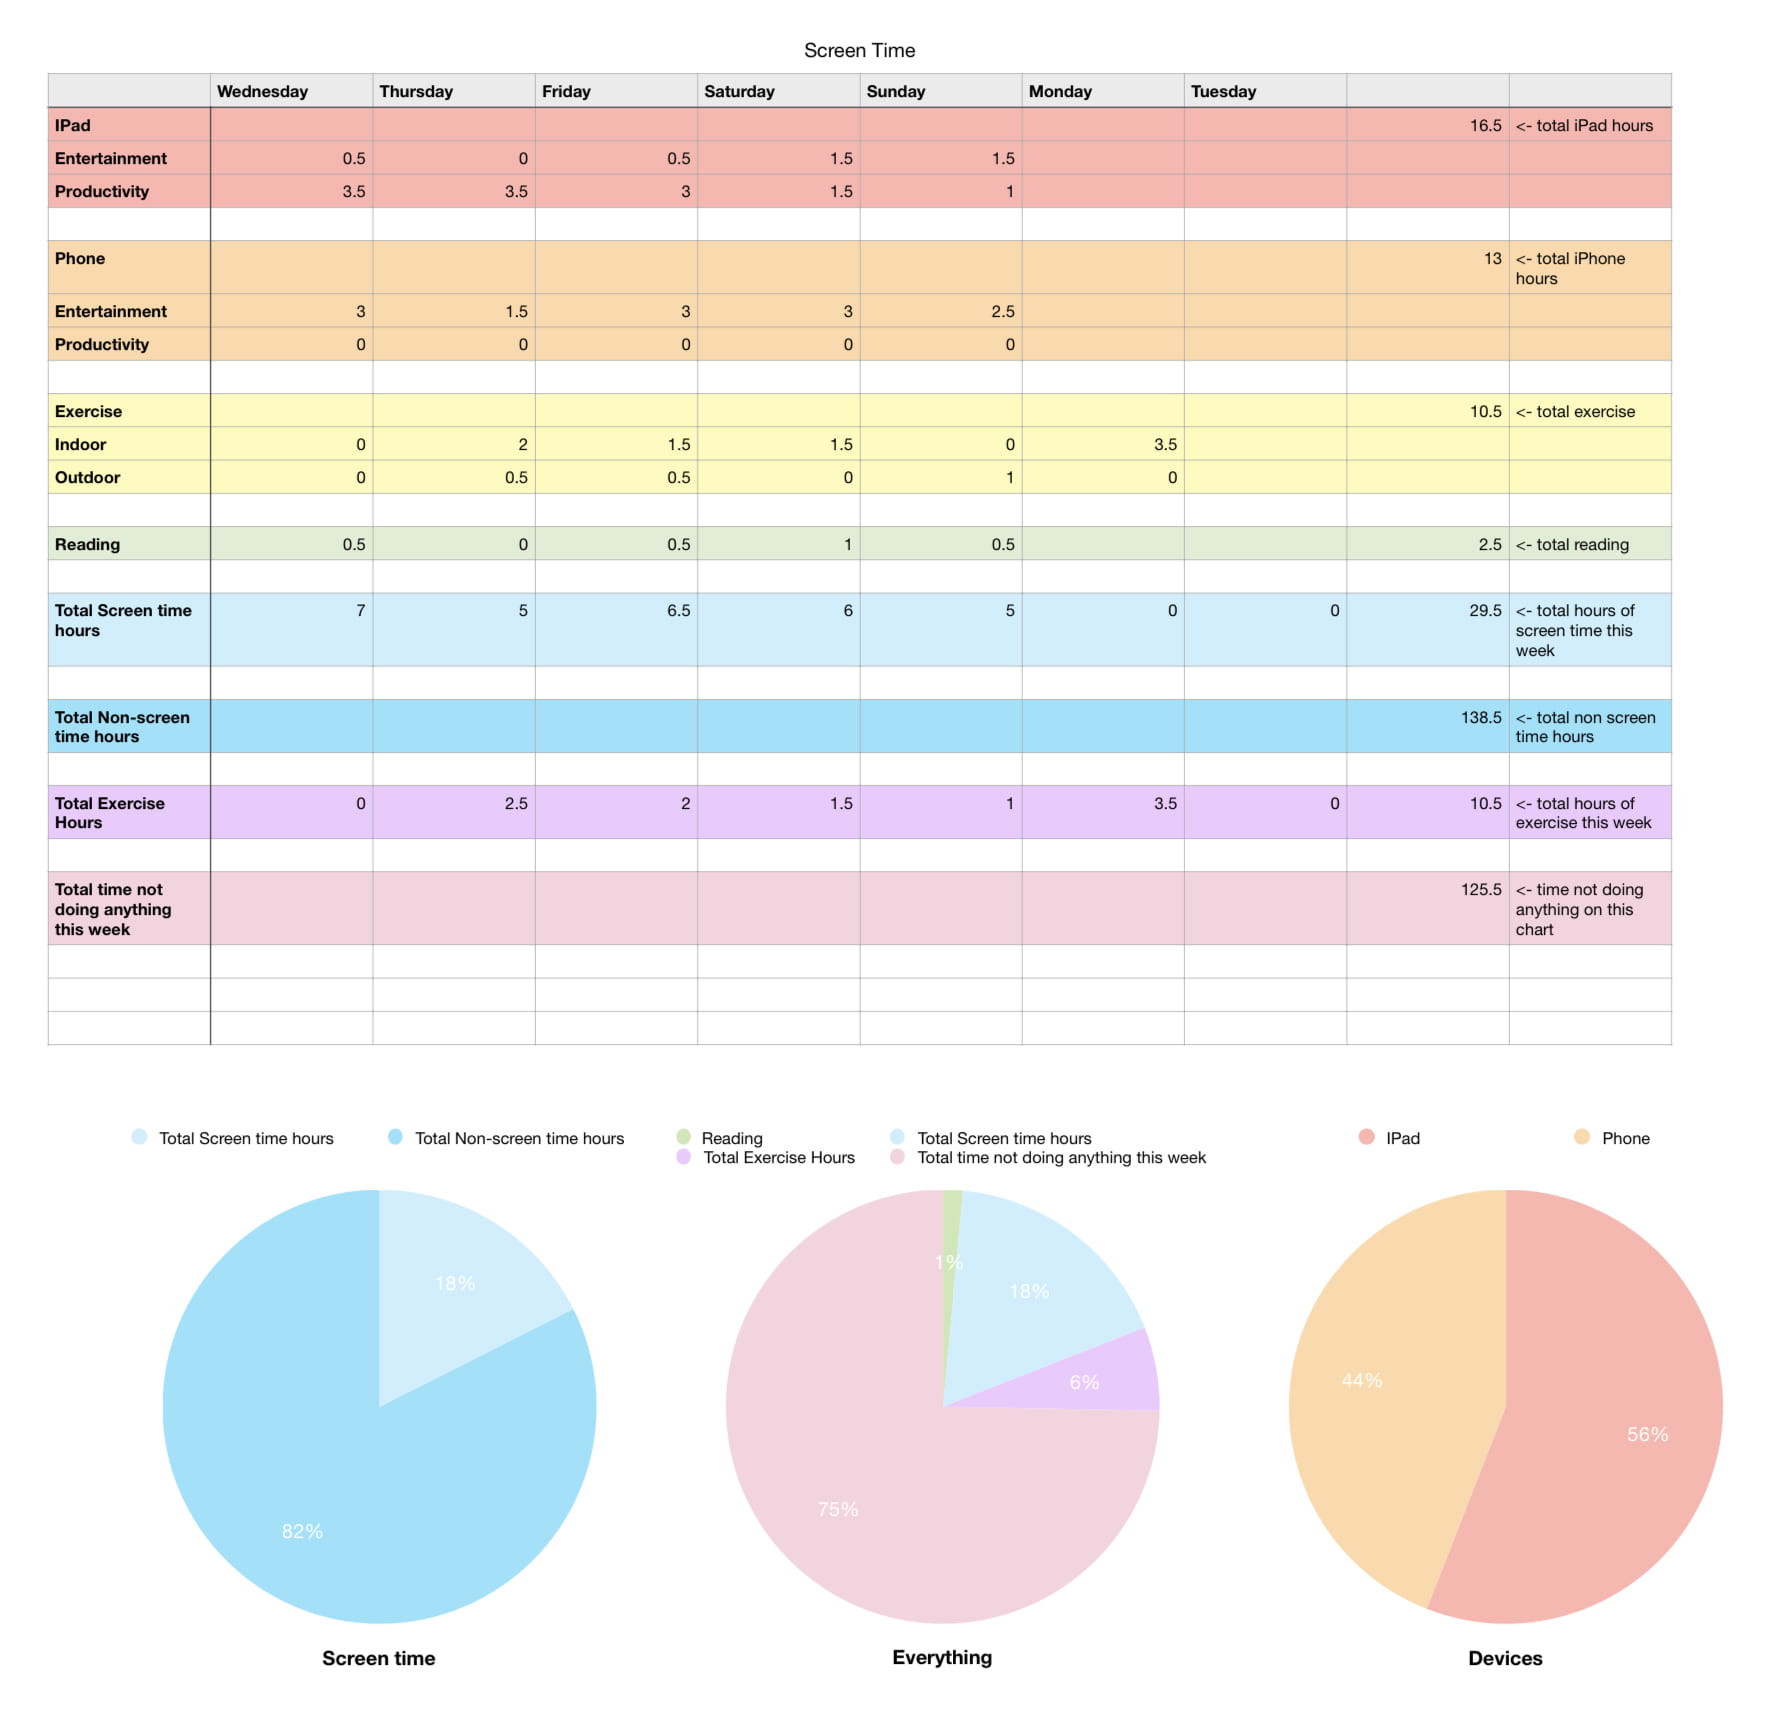
Chart Drafts:
Core Competencies:
Applying and Innovating:
I demonstrated this competency proficiently by using my class efficiently for learning. Me and my partner Alicia worked well together. We checked and compared our homework to see what we did right and/or wrong. We also helped each other with our screen time charts. When one of us found a new hack we would share it with the each other to make our charts better. I think that my demonstration of this competency shows my care for self, others, and the community.
Understanding and Solving:
I exhibited this competency outstandingly by having a colourful, descriptive, and in depth screen time spreadsheet. I included my screen time usage, reading time, and exercise time. For each of these sections I included the daily averages and total hours. I included comparisons as well. I think that my demonstrated of this competency shows a full visual of my screen time usage.
Communicating and Representing:
I established this competency outstandingly by having not only 2 things that I recorded in my chart, instead I had 3. I made 4 colourful pie charts and 3 line charts. In the pie charts I showed how much screen time I had compared to my non-screen time, the devices I used in comparison, what percentage reading, screen time and exercise takes up of my day, and the days of the week in comparison to how much screen time I had. I represented mathematical terms in concrete forms efficiently.
Overall this project was very informative. I had fun learning the ropes of numbers and it was a cool way to showcase our screen time.
Au revoir 👋🏻