Welcome to the last Scimatics blog ever, wow time flies. For this project we were tasked with creating a product, selling it, then graphing how much money we will make.
If you want to watch the final product, you can see that here:
Understanding and solving
To start off we learned about all the math concepts we needed to complete the project. This included many text books and Khan academy quizzes that actually took quite some time. I also spent my time helping others with the math, and apparently I’m a pretty good math teacher (Go me!).
Once we learned all we could about the different math concepts, it was time to create and sell a product. I went through many different product ideas, but eventually landed on making little stands that you could use to prop up your phone.
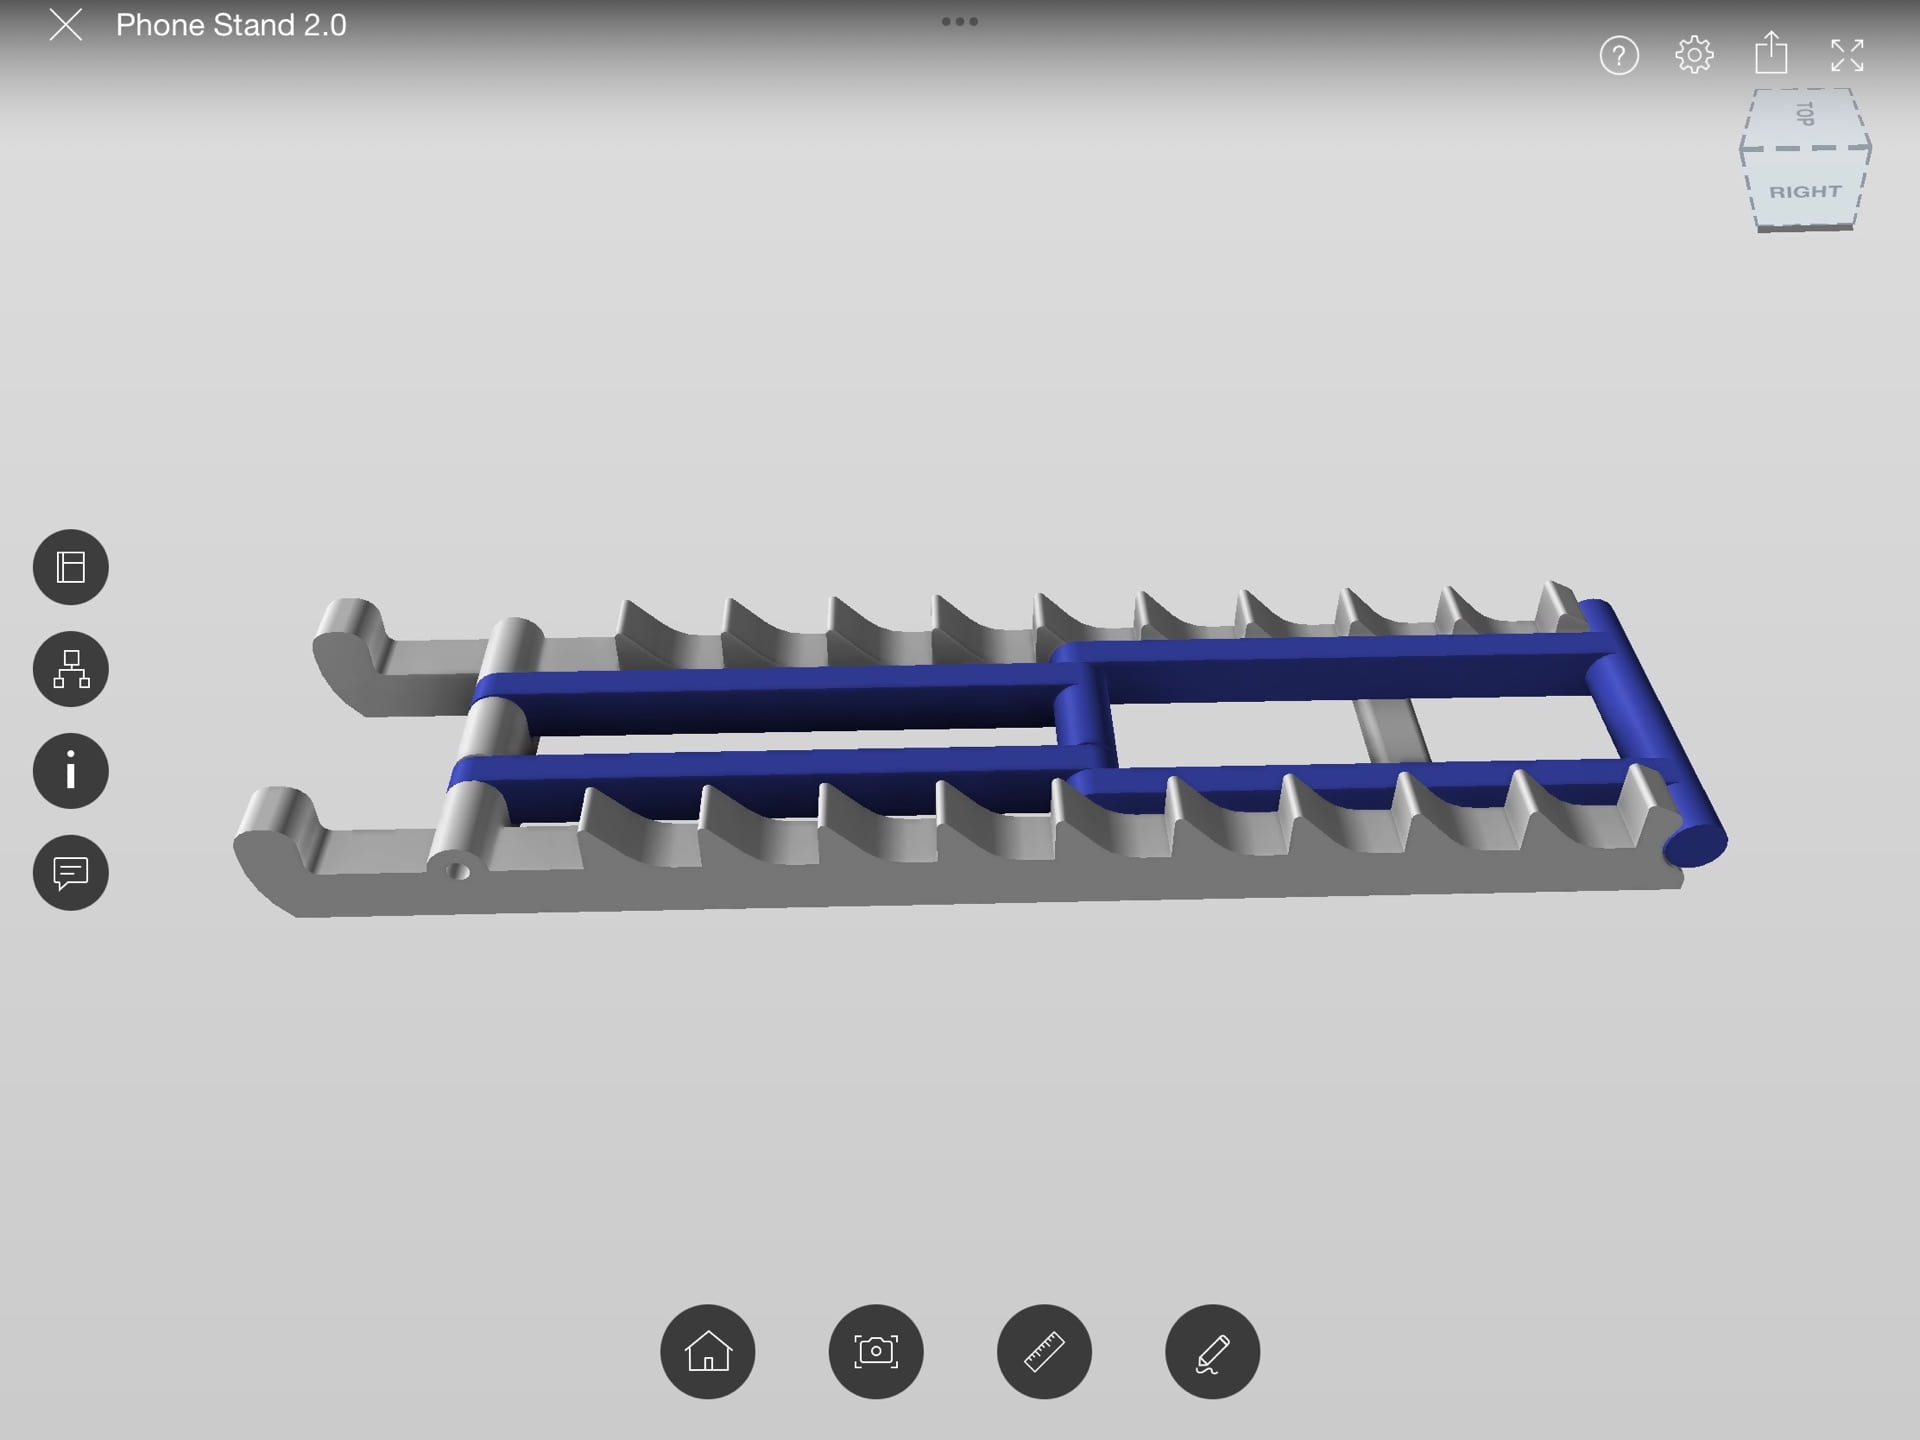
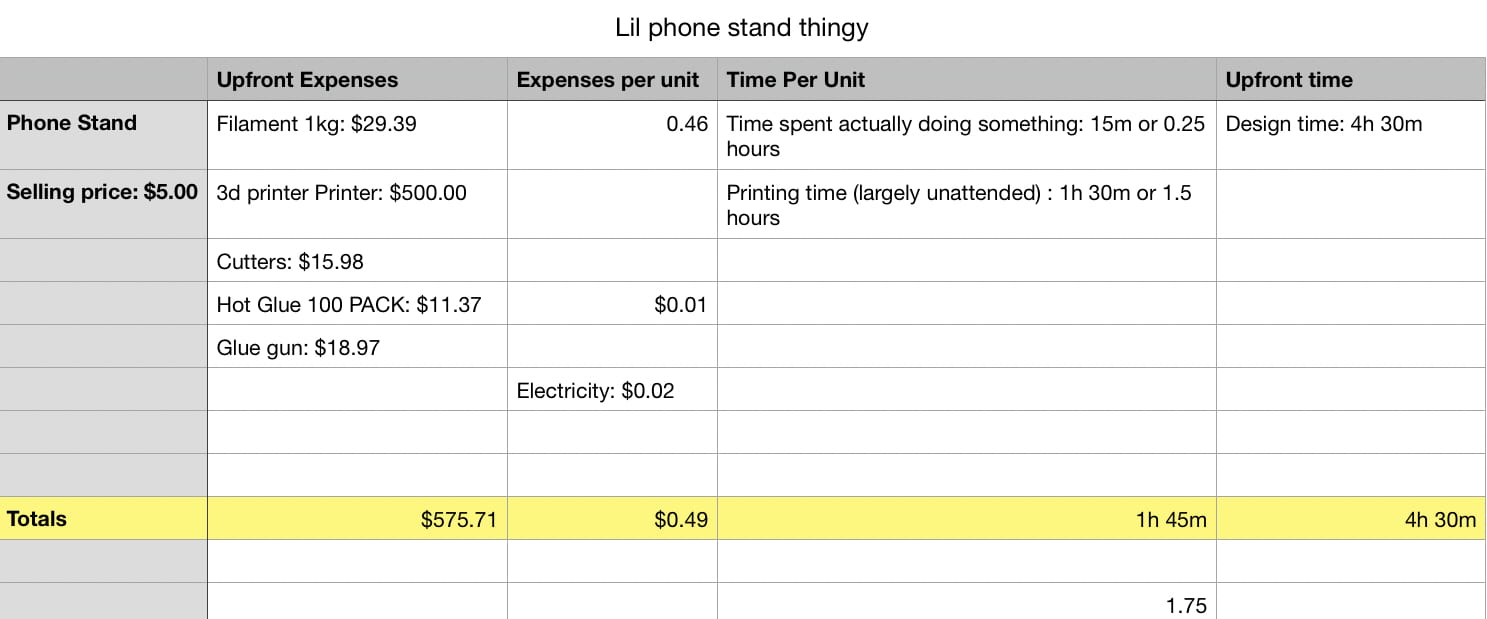
To later graph our project, we first needed to know how each phone stand was going to cost and how much time it would take. This ended up being pretty easy to record. When you slice a print, it tells you how much time it’s going to take, as well as how much plastic filament is needed. When I was putting it together, I just timed myself to get the total production time to 1 hour and 45 minutes. Then to find an appropriate selling price, I used this print on demand calculator made by Prusa. After entering all the required information it told me that a decent price for my product is 5 dollars, so I made that my selling price. The calculator also takes into account the cost for electricity, so that was also added to the final chart.
Overall I used many different strategies to find all the required information for my product
Communicating and representing
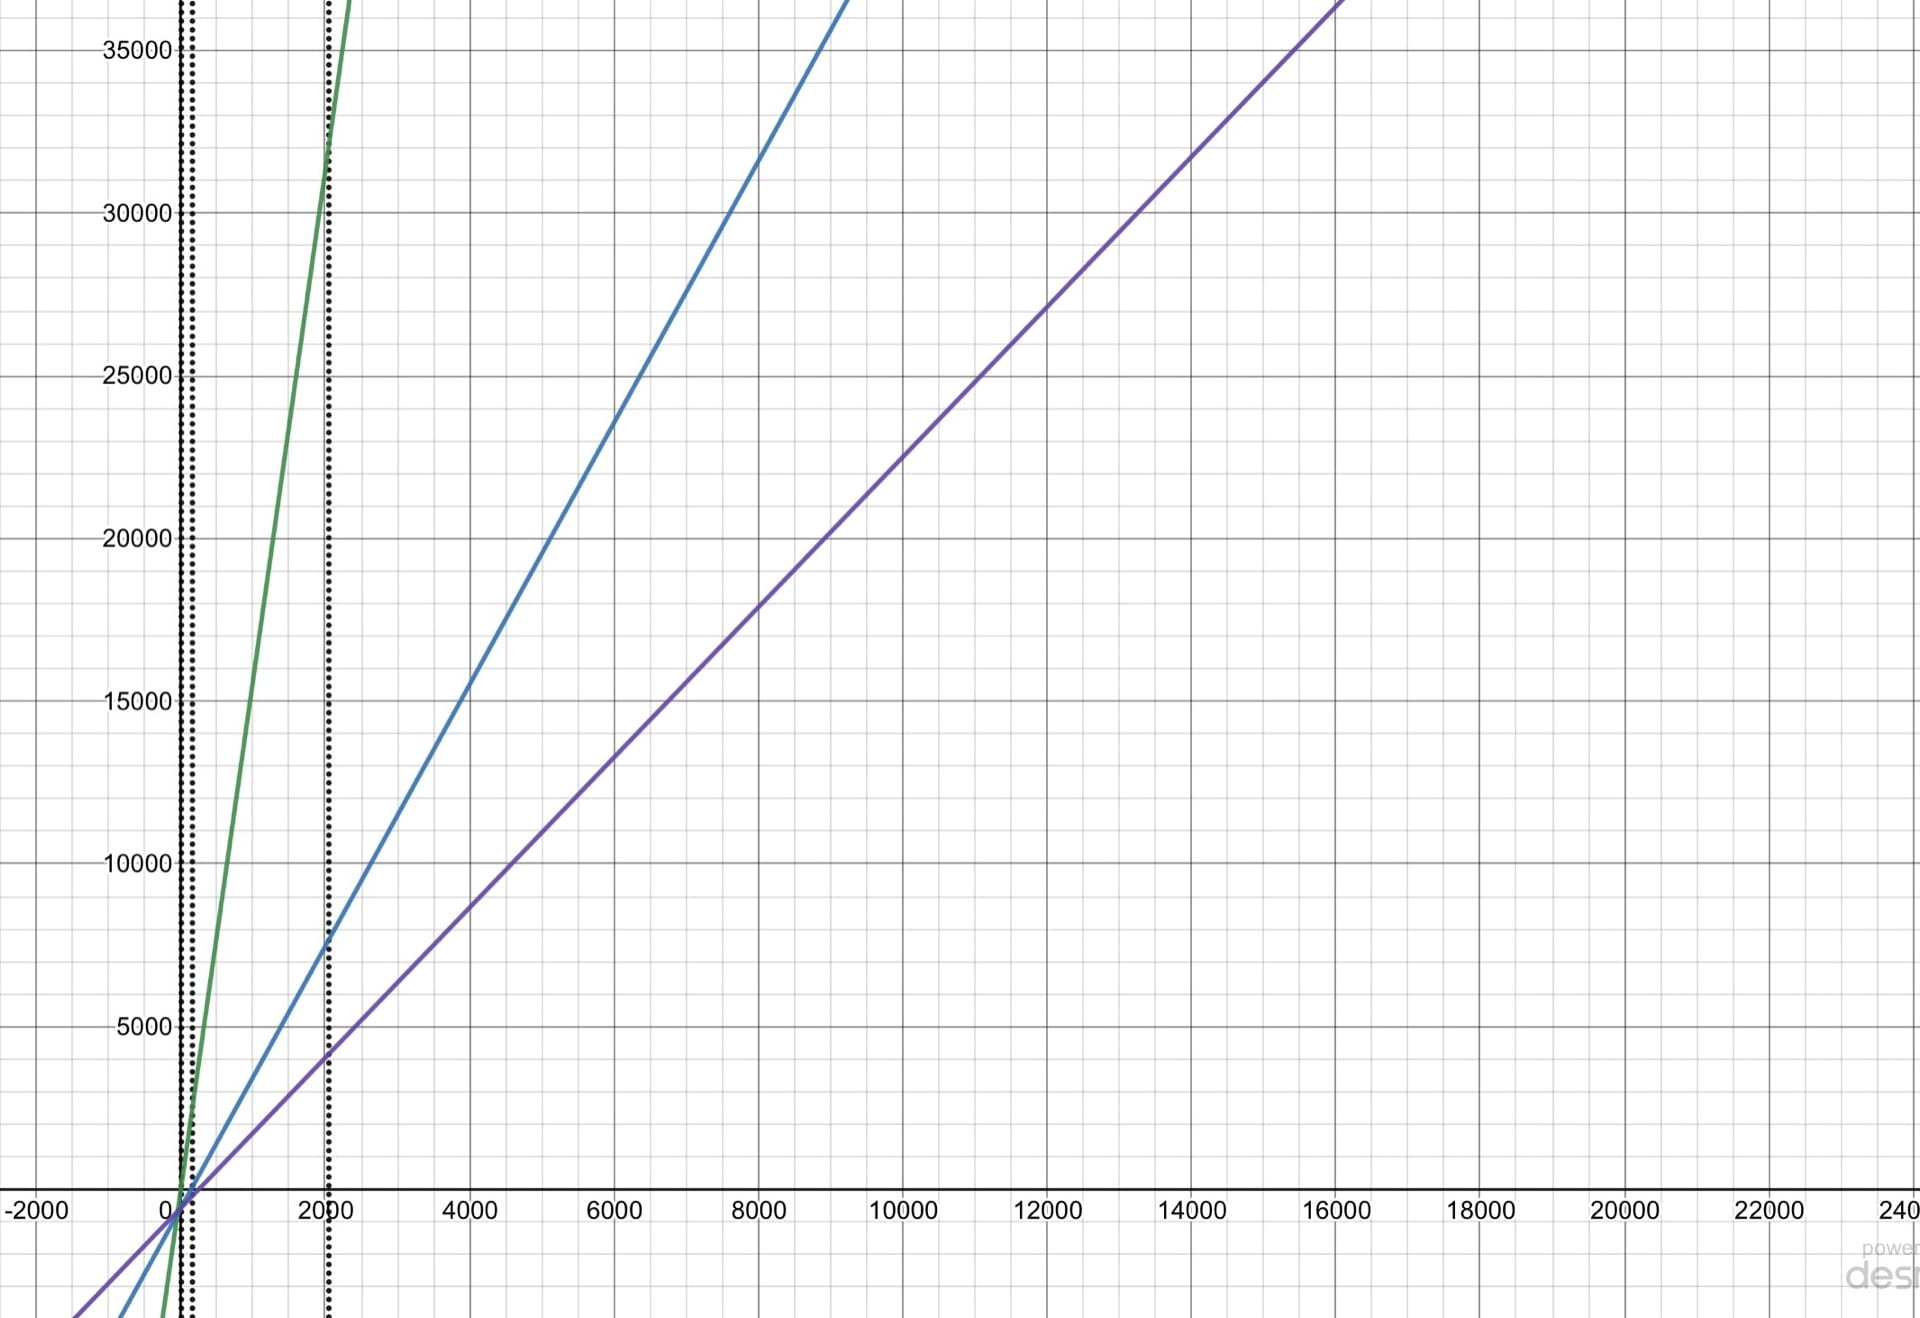
The next step was to graph it. For this we used the Desmos graphing calculator, which made the process very simple. All I had to do was input the equation into the calculator and it would create the line for me. I could’ve ended there but I decided to put a bit more effort into it. I added some vertical lines that show how much money I’ll make in a day, month, and year. I also added another line for how much money I’ll make if I got a job for minimum wage, as well as if I sold my product for $8.00 instead of $5.00. I also used the customization features to make the graph more clear, and to make the important lines pop out more.
Connecting and reflecting
Finally like pretty much every other Scimatics project it was time to make it into a video. However before I can get to that, there is one other part of the project that needs to be done. This was to connect our product to science and the environment. After learning about the different environmental cycles, we had to find different ways our product influenced each cycle. I focused on the environmental benefits of 3d printing, and did quite a lot of research to find different connections. It turns out that the different ways 3D printing differs from other types of manufacturing was pretty interesting, and I wanted to highlight that in my video.
Since we’ve done so many videos before, it wasn’t the most challenging. I decided to make another keynote magic move presentation as it makes the visuals more interesting to look at. I also spent more time on making my script more concise, and not blabbing on about random facts that aren’t that important. Overall I put attention on making my learning interesting instead of a boring business meeting.
Another note from making the video, was I used the freeze feature to make timing the voice over to the video much easier. It’s pretty cool how many features I’ve learned over the years that have made my work better and more effective.

Over all this project was a cool combination of my hobbies math, and a bit of science. It’s a bit sad that this will be the last Scimatics project ever but I’m excited to continue building on the these skills for many years to come.
See you next time,
Nolan