

Looking for a Cellphone Plan? Ours will give you the cheapest monthly payment! Don’t listen to them, ours has the best call minute rates! Oh yeah, well ours gives you the most data per month! With every cell service provider on the market telling you why they’re better than the competition, how can anyone make a real decision of what plan would be best for them? Well, in our latest Scimathics unit, we learned how to do just that, building off of our previously learned concept of Linear Equations. If you want to know how exactly we one can do this, and why you should NEVER choose Telus for a plan that needs cheap roaming data, then read on!

Our Unit – A Deeper Dive Into Linear Equations
When this unit began, I only knew the concepts on this Mindmap:

As I talked about in my previous Scimathics post, our current focus in this class is all around the concept of linear equations. These are, as the name suggests, equations between two variables that gives a straight line when plotted on a graph. One of the most common equation forms is known as Slope Intercept form, which can be seen below:

As I talked a lot about how exactly these equations work in my previous post, I won’t be going in to much detail about that here, but rather will be exploring some of the new concepts we learned. The first thing we were introduced to when kicking this project off was the concept that two linear equations can be compared graphically through something known as a system of equations. These are two or more equations with the same variables:

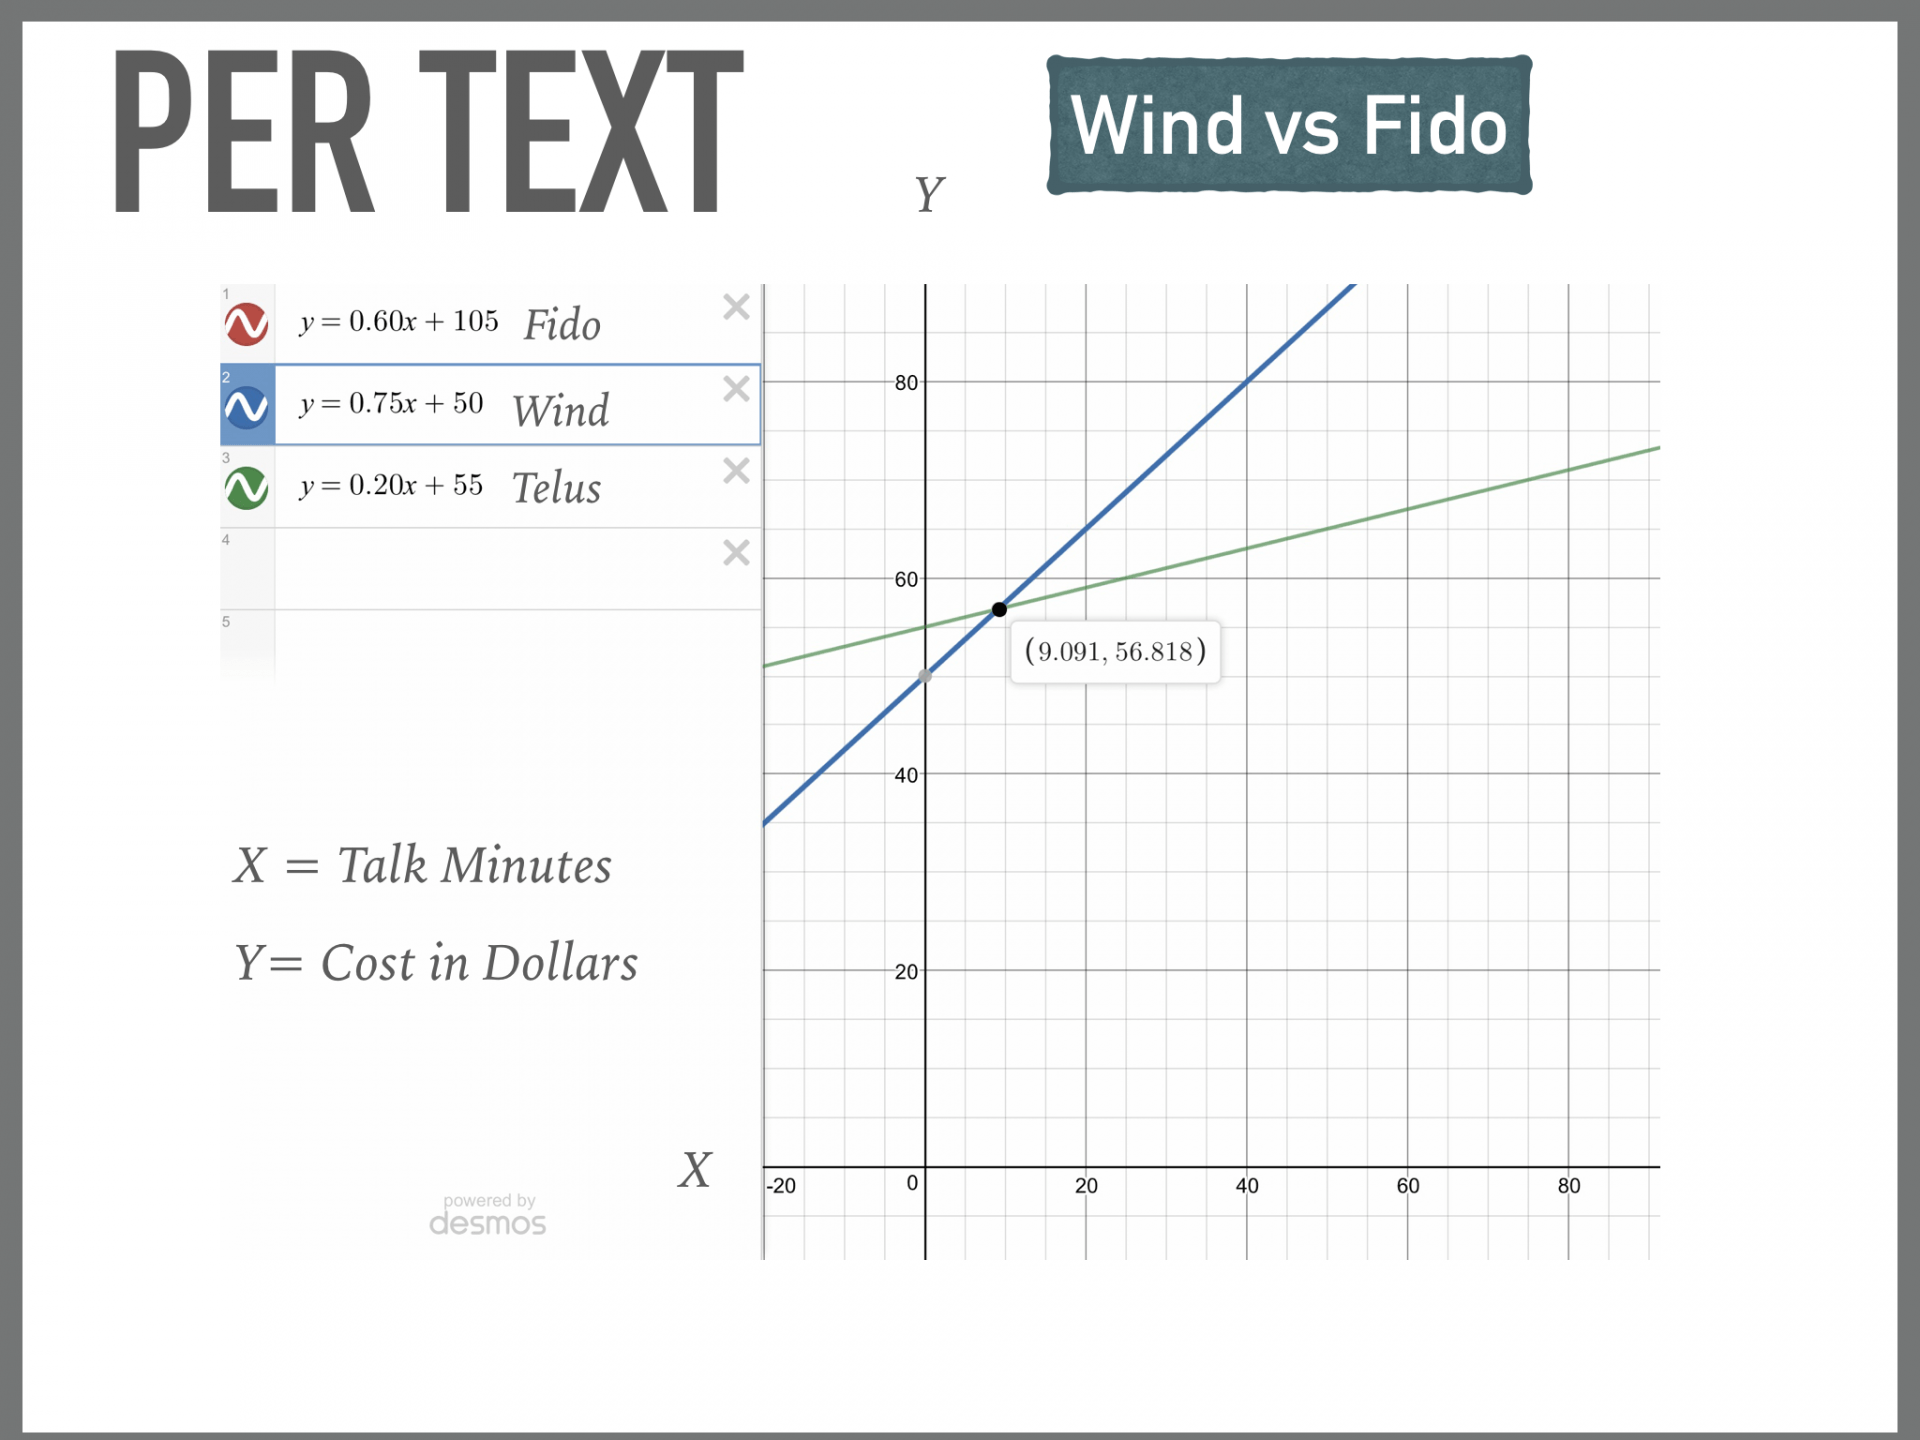
If these two equations are different in terms of their slopes and their Y intercepts, then their graphical lines will intersect at some point, creating what is known as the solution. Since linear equations are commonly used to measure and compare things such as cost, the solution could be when two things with linear trends of increasing cost would cost the same, which in our case is a crucial step to determining which cellphone plan would be the best. You can see a solution between the roaming talk time rates of Fido and Wind (now Freedom Mobile) below:
Sometimes however, the slopes of the equations may be the same, which would cause their to be no solution as you can see below:

Or sometimes, the equations might be identical, which means that there would be infinite solutions:

There are two ways that you can find the solution for a system of linear equations. One is algebraically, which you can see an example of below (once again with the system of equations including the talk minute rates of Fido and Wind):

You can also solve plans graphically, or use this to check your answers:

After learning all of these concepts, my unit Mind Map ended up looking like this:

Our Project
Once our knowledge on the concept was solidified by worksheets and Kahoot quizzes, we were ready to get into our project. Our job, was to create a system of equations for a couple of cellphone plans of our choice, and the from their solutions, figure out which one would meet a specific set of criteria the best. For my project, I was put in a group with Melika, and we decided to compare the roaming text and talk minute rates of Telus, Fido, and Wind, to see which plan would be the best for our PLP trip to the United States next year. Through some estimating, we were able to come up with a predicted amount of texts and call minutes we would need (40 texts and 15 call minutes), and then use this to find our plan of choice. Looking at the data, although Fido had a monthly rate of 50$, which is cheaper than the Wind rate of 55$ and the insanely high Telus rate of 105$, Wind has a cheaper text rate over 9.091 texts than both plans, and also has a cheaper talk minute rate over 5.263 minutes, so it is the best option.

Curricular Competencies – A Reflection
Every project we do in PLP focuses on a large variety of Curricular Competencies, but there are a few that stood out for me during this project in terms of improvement:
Model with Mathematics in Situational Contexts
 In this project, we used detailed labeled graphs to demonstrate all six of our intercept points, instead of just showing the ones we are directly considering. These graphs included our mathematical equations, which were then explained later through models of both algebraic and graphical forms of solving them. We also used graphs to show the different situations where there could potentially be no solution, or infinite solutions, and then modelled how much we could potentially save with the best plan choice in the future, or when the other plan might actually be better, which depended on the situation that the person considering the plan was in. From our last linear equations project, I have improved at this by using an extensively larger amount of graphs, and considering countless more situations that could potentially affect our data.
Explain and Justify Mathematical Ideas and Decisions in Many Ways
 The big decision of this project was which cellphone plan we should use based on the mathematical data we had gathered, and in coming to this decision we both explained and justified our process in countless ways. For one, we explain the way that we got our linear systems and graphs both though algebraic methods (which we not only show on the screen, but walk through step by step) and in graphical methods which we also explain our use of functions during. When justifying when we came to our decision of Wind, our presentation outlines the potential savings you would get with the plan compared to the others, and also considers the monthly rates, the text rates, and the talk minute rates, instead of just one of those areas. We also justify our use of roaming rates as our chosen place of data use is in the U.S.
Connect Mathematical Concepts with Each Other, Other Areas, and Personal Interests
 In our project, we bring in three diverse data plans and analyze numerous aspects of them (including monthly rates, roaming text rates, and roaming call minute rates) to connect and compare them to the best of our ability. We also bring in the personalized driving question of “How could PLP students going on our grade 11 trip to the U.S next year get the most affordable cell phone plan?”. We also connect and build upon concepts learned in our previous unit such as functions to enhance our knowledge, and better connect our equations to get accurate results. I have improved upon this from last project by actually creating a comparison between multiple aspects of different trends, instead of just analyzing one trend over a period of time without including the use of diverse mathematical concepts such as algebra.
Visualize to Explore and Illustrate Mathematical Concepts and Relationships
 Our project visualizes mathematical concepts and relationships in a variety of ways. For one, we explore the relationships between each of our systems of equations with the visual representations of equations that are graphs, which are complete with numbers, titles, the original equations, and labeled axis for better visualization. We also show diagrams of concepts such as Slope Intercept form for better analysis, and illustrated the steps in our algebraic and graphical methods, so that they audience an better visualize them. Also, every time that we bring in a new concept, such as the idea of no infinite slopes or no slopes, we explore them though visual representations of on our slides.
A Personal Reflection
For me, due to it’s structured nature, mathematical information needs to be incredibly precise for me to feel like it is accurate. If I don’t go into great detail about my findings, process, and proof, I feel like I am not completing the task. This feeling however, has gotten me into trouble as many of my presentations, including this one, end up being way too long and complex for the audience to follow. It also puts unnecessary work and stress on me, along with on my teachers who have to go through everything to mark it. In light of this, I am making a personal goal to do exceptionally well at the exact criteria for our next project, and include nothing extra unless I have the TIME, or Time, Importance, Materials, and Energy to do so.