Correlation vs Causation


This scimatics project was called correlation vs causation.  The driving question was “how are correlation and causation different”? In order to answer this question, we took many steps including creating our final product which was two correlation and causation graphs that we presented to the class last week. 

We started off with a start mind map. Below you can see photos of the start mind map along with the end mind map. 
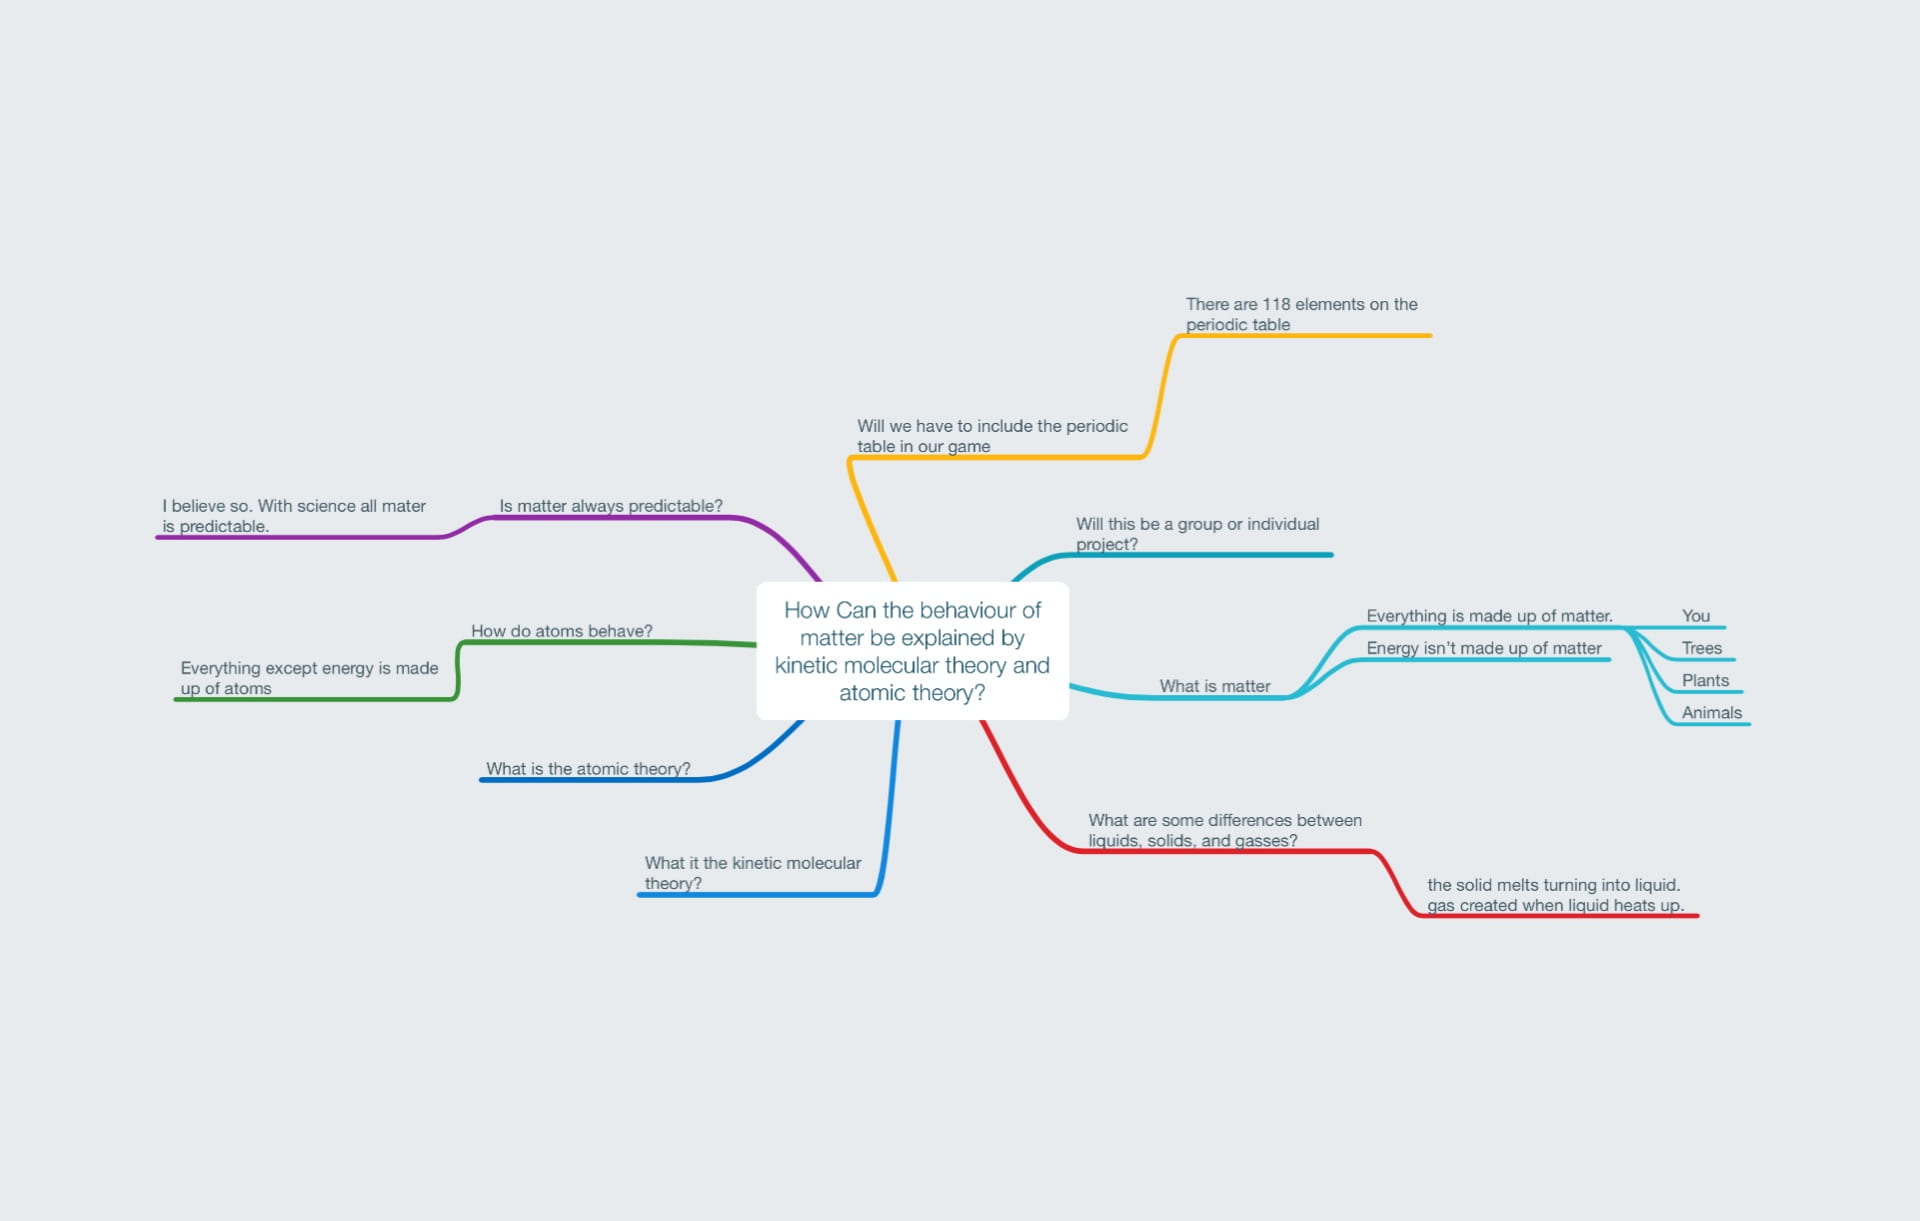
 

Start mind map

End mind map


Next my partner and I came up with over 10 survey questions the questions we asked on our survey were. 

Then with those questions and the peer critique we got from them we put the questions in a survey using google forms. Then we sent out the link to Basecamp and all the plp 9 group chats we had. While we waited for enough responses to come in we did other peoples surveys.

Clare and I got 23 responses to our survey and with that data we were able to put them in a chart with a graph attached in order to find out which two questions had correlation. Originally we thought that being an introvert or extrovert would correlate with what job you wanted to do in the future but with our data there was no correlation between those two areas.

We then changed our focus to the questions about how comfortable people are around other people with how comfortable you are then speaking your mind. Our second correlation was about how comfortable you were speaking your mind and how much screen time a person had on the average in a day.

We not only found correlation with our first graph but also causation. The more comfortable you are around people the more comfortable you are in speaking your mind. Unlike the first graph, we did not find causation in the second graph. 

Finally Clare and I presented in front of the class in a key note presentation. I think our key note slides were good because we didn’t put paragraphs instead we had bullet points that highlighted what we said. Our presentation skills were not as strong as our slides. We kept reading off of our iPads and did not look up at the audience. I feel like I could speak more clearly and confidently in the future.

Curricular competencies 

 Planning and Conducting: select and use appropriate equipment including digital technologies to systematically and accurately collect and record data.

I achieved an accomplished in this competency. I conducted a survey through google forms and found two correlations using the survey results. I used Numbers app to create the graphs and I used the keynote to present my results to the class. One graph was a weak positive correlation while the other was a weak negative correlation. Clare and I were not able to find a strong correlation with the data we collected.

Communicating and Representing: use mathematical vocabulary and language to contribute to mathematical discussions.

I achieved an extending in this competency as I used mathematical verbal and pictorial explanations that helped the class understand the data. Clare and I were able to successfully explain how one of the graphs had both causation and correlation while the other one did not have causation. We showed the difference between correlation and causation and how correlation is sometimes falsely associated with causation. We used a funny cartoon to help make our point. 

Applying and Innovating: contribute to care for self, others, community, and world through collaborative approaches.

I achieved an accomplished on this competency by conducting good, ethical surveys, using my class time efficiently, and being partners with Clare. First of all we made the survey anonymous so people feel more comfortable being honest in the survey. Then Clare and I used our class time well and went to LAC as needed. We met early a couple mornings to work on our project and we would FaceTime to create our graphs and prepare for the presentation. One time she was in a meeting and I did not post the survey until she had read it over and we talked about it. We both can give our opinions and if we disagree we compromise or ask for a third person’s opinion.

It was challenging to find correlations. I did not think it would be too hard but as we read the data our original ideas did not correlate. I learned that the questions I ask are important to ask well and that you need be open to look for other correlations and other factors. Presenting is also hard for me. Clare and I made good slides but we were very nervous and did not speak clearly. It would be interesting to conduct more surveys in the future to see what else I could learn. 

Take our Kids to Work Day!!!!

Hi this blog post is about a career is 9 project “take our kid to work day” where each grade 9 student had to go with a parent or family friend to their place of work to learn about how that person makes a living and contributes to their household. I went with a family friend, Mrs. Murray, who is a grade 3 teacher at my old school. 

I went from 7:30 in the morning to about 4 o’clock. I helped out in the classroom organizing files, folders, handing out tests, and helping a couple students. Working with small groups, I assisted students with their social studies learning. It was particularly interesting to go back to the same school and classroom that I went to for grade 3. I really enjoyed going back there and helping out in the grade 3 classroom. 

Look at the videos below to see some photos and an interview that was taken on the day while I was there. 

Overall I really enjoyed take your kid to work day. I enjoyed seeing the kids and helping them out. The classroom was as loud as I remembered for grade 3!  I really enjoyed seeing Mrs. Murray work and I loved her creativity. She created a whole money system with the grade 3 classroom which surprised me because  I thought it might be too complicated. The students have fake money from doing jobs and having clean desks and they can do more jobs for more money because they need the money for things like prizes and for rent on their desk. I really enjoyed and learned a lot during take our kids to work day. 

When I arrived at home, I was exhausted!

Summative blog Post  People and the Environment 

This humanities project’s topic question was “How do people and the environment affect each other.” We had to write a letter about an environmental issue in bc saying what the problem was, showing some evidence, and finding a solution. We would then be sending the letter to someone who could make a change on the issue. 

An important part of this unit was our common lit reading and writing assignments. We read about environmental issues and how they affected people and how people affect the environment. Sometimes the environmental issue was presented through a story or article and one time through a poem called “Turtle’s Song”.  We had to read the writing and answer the questions as well as complete writing responses. I found the “He-y, Come on O-it” the most interesting story even though it was fiction, it showed the idea that people need to be aware of what happens to waste. It doesn’t just go away. Short term solutions aren’t the answer.  For the Common Lit Milestones, I learned a lot about how to write about environmental issues and connecting ideas in between stories. The picture I included shows evidence of my learning as well as shows the curricular competency: I can analyze how texts use literary devices to enhance both meaning and impact.

Another way we were answering the driving question was through the letter which was the product of the whole project. I chose to write my letter about microfibres in our waterways and how they get there through an everyday activity, doing laundry. In hopes of making a difference I chose to write a letter to the Minister of the Environment in BC. His name was Honorable George Heyman. I wrote many drafts of the letter that was critqued by many different audiences. One grade 12 student told me to make my letter more concise. This comment made me shorten my letter and get to my point more quickly. My drafts including my final letter are below. The letter and every step I did to make the letter showed two curricular competencies:

  • I can use writing and design process to plan, develop, and create original, and engaging and meaningful texts for a variety of purposes and audiences. 
  • I can reflect, assess and refine texts to improve clarity, effectiveness, and impact for purpose,   audience and message.

Drafts of letter

Final letter draft


Something I found very amusing was the fact that almost NOBODY in our
class knew how to write the address and return address on the letter. The teachers had to take extra time to show us how to do this and give us extra
time to do it! Because we normally don’t use pencils (especially mini ones) it was hard to get the lettering straight and neat. I’ve never personally had to address a letter before. It shows how difference between my generation and ones before. 


Another evidence of my learning all three of these curricular competencies is the common lit connections multi paragraph assignment. We had to tie the common lit readings to our letter in three paragraphs. The most challenging part for me was understanding what was being asked of me to write. Even after I asked my friends I didn’t understand what I had to write. I understood all the stories and the letter but didn’t understand what I actually had to write. After completing the outline and making a theme statement it was more clear what I had to do. The photo below is the common lit connections that I did with Mr. Harris’ critique on how to improve.

I enjoyed learning about the environmental issues in more depth than I have done in the past. This was a very open ended project where we had to research and find an environmental issue here in BC and find a solution. At the beginning of the project I didn’t think we could come up with solutions but everyone in the class had a great idea of how to solve their issue. By researching how doing laundry affects the ocean so much, I realized that everything we do affects the environment.  Even though I think that there are more destroyers than protectors in our world right now, there are lot of people who are making a change in the 21st century. Everything you do affects the environment. When the environment is affected, we are affected too. SO BUY A MICROFILTER!!

Exponent Apocalypse!!

This project was called “Game of exponent laws” and as you can probably guess from the title is about exponent laws. For our project we needed to design a board game based on exponent laws and mathematical operations. 

We designed Exponent Apocalypse! Our game takes place during a zombie apocalypse. A scientist with a cure and a Zombie are racing to get to a lab. If 
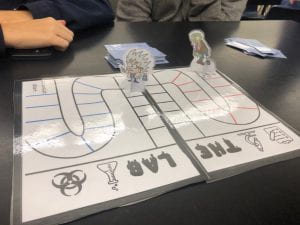
the scientist gets to the lab first she can mass produce the cure and save the world. If the Zombie gets to the lab first, he would destroy the Scientist and the Zombie’s would win. This is a two player game that lasts about 10-15 minute and uses exponent laws to decide who moves forward.


Curricular Competencies

Reasoning and Analyzing: Use logic and patterns to solve puzzles and play games

I earned an extending on this curricular competency. My point system was clear, and simple. The first person to get an equation right moves forward one space. The point system wasn’t just earning points it was about using the equations to move towards a goal. The conditions to win were effectively designed.

Communicating and Representing: Represent Mathematical ideas in concrete, pictorial and symbolic forms

I earned an accomplished for this curricular competency. My instructions were interesting and personalized as we turned it into a Zombie Apocalypse. There is a speed factor to get to the end before the other player making it a fun competition. I had one page of clear and complete instructions with lots of pictures and examples. I think I only earned an accomplished not an extending because I only used 4 exponent laws which was the minimal amount. Even though we didn’t have turns, there were rounds and at least one exponent law was used in every round.

Applying and Innovating: Contribute to care for self, others, community and world through individual and collaborative approaches

I earned an extending on this curricular competency. I worked well with my partner. We both had ideas that were used in the game. We did trials with game ideas to see what would work and we divided up tasks well according to our schedules and talents. I left the drawing to her but I got all the equations organized. We didn’t have a problem staying on task and focused on the game throughout the project. 

I really enjoyed trying out my own game and other games around me. I found it interesting to try out other people’s games and see how much variety of games there were when we all had same driving question. It was also rewarding when other people played and enjoyed our game that we spent time making. I enjoyed the creativity of this project and making it based around the theme Zombie Apocalypse. 

Comic Cells

678yt“Comic cells” was the name of my last ever grade 8 PLP project. This project was all about the driving question “How do cells and diseases interact”. For this project we had to create and research a comic book about cells. The comic book had to be about cells and diseases or be about a cellular process.  

My end mind map below shows some of the things that I have learned about cells and diseases. 

Milestone 3 where I learned more about diseases.


Curricular competencies.  

I demonstrated the competency of “Questioning and Predicting”. First of all I read the materials and watched the video that was needed to complete milestone 3. I also participated and loved the experiment that Mr. Gross set up in class with the beakers and learning how to track who had the virus. This sustained my curiosity about cells and diseases and I tracked who had had the virus on my iPad as well as following with the class on the board. Lastly, I demonstrated this competency by using my class time efficiently and then coming in to flex block to make sure I got it done well.


I demonstrated the “Scientific Communication” competency.  Firstly, I used more than 10 scientific words in my comic book and I also used them in a way that showed I understood them. I also showed that I met this competency by using diagrams to show the inside of an animal cell. Lastly, I showed this competency by using different apps to represent the science I am learning. Apps like Comic Life 3, where I put together all the panels of my comic to make the finished product. I also used Sketches Pro to draw and create the images included in my comic book. These technologies help me present the problems and solutions of this scientific topic of Cells and how they are affected by disease.


I showed the “Evaluating” competency in my comic. First of all when I chose the Variola/Small pox virus to be the main topic of my comic book. The setting of the lab and how I showed the virus being transmitted easily on a bus showed how I researched and then applied how it could be spread. I was specific when I said it would at least 7 days until the person saw visible signs of infection. Also when I showed that it would cause a world-wide pandemic, it showed I knew the material and could apply it to my comic book. I evaluated the research and then put it together in a very interesting and scientific story. The cells and the virus acted in a scientific way by how the virus replicated and by how the cells would react. 

To answer the driving question “How do cells and diseases interact”, my comic book shows how the cells, diseases, and people would react to the smallpox diseases. It explains how the immune cells rush to the inflamed area to attack pathogens, how a vaccine would help the cells, and a few more ways they interact. See my comic book below.

Click on image above 👍


I really enjoyed making this comic book. I didn’t think I would enjoy creating this story but I was a lot of fun. I didn’t really enjoy drawing all the scenes but with the help of an app called Sketches Pro it was a bit better. Overall this was a very interesting and enjoyable way to learn about cells and diseases as well as a good way to show what we had learned. 

The ultimate design challenge!

This project was all about calculating the surface area and volume of 3D shapes. Our driving question is “How can we design an object to optimize its shape?”. To answer the driving question we had to create 3D shapes in groups from 1-3 people then we had to create one or more 3D shapes on an app called Tinkercad. The object (or objects) had to be created to optimize surface area or volume. After we designed our objects they were supposed to be printed out in the school 3D printer which we were sadly unable to do. 

With a group of two of my classmates Clare and Jocelyn, we created three objects of our choice that we all decided  would be a famous European architecture. 


The London Bridge (mine)

The leaning tower of Pisa (Jocelyn)

Big Ben (Clare)

I won’t mention all the milestones but here are the two I think most important ones. Milestone 2 was the milestone where we had to create our 3D shapes in Tinkercad. This was hard because we had to first learn how the use the app then needed to find a way to create our 3D shape. I had a lot of trouble because I kept getting kicked out of the app. In the end I was able to use that app to creat a pretty good replica of the London Bridge. 

Milestone 3 was also important as that was when we had to hand in all the calculations. We had to find the surface area and volume of all the shapes  to find the totals for the whole 3D object including the ratio of surface area to volume.  

Curricular competencies 

Applying and innovating: contribute to care for self, others, community, and world through personal or collaborative approaches.

I showed this competency not only when I used most of my class time well but
also when I helped my group and when they helped me. I helped my group a little in the building of our models, I also helped in the creation of the slideshow that we presented to our class. My group members helped me with the creation of my own 3D bridge.  

Reasoning and Analyzing: Model mathematics in contextualized experiences.

I showed this curricular competency when I found shapes within my 3D model. I had to figure out what some of the more difficult shapes were especially the tunnel under the bridge. I decided that it was a half cylinder that was going through the rectangular prism. In order to get the right volume and surface area of the rectangular prisms I had to minus the volume and add the surface area. My whole object together has more volume then surface area, with a 1.5:1 ratio.


Communicating and representing: Explain and justify mathematical ideas and decisions

I showed communicating and representing when I calculated, measured, and found the ratio of volume to surface area (1.5:1) of my 3D object. To do that I had to find the volume and surface area of all my shapes. I had to find a formula for each type of shape then I had to find all the heights, lengths, and other things like that. I also showed this competency when my group and I presented all of this information in class. We didn’t go into as much detail  about our calculations  in thePresentations as was required for the project. 


In the end I was able to answer the driving question “How can we design an object to optimize its shape?”. we can design an object in Tinkercad and move and change shapes to optimize its volume or surface area. The hardest part of this project was all the calculations they all had several hard steps just to find the volume/surface area. Even though I wish it could have been 3D printed, I am very proud of all the shapes my group and I made.

Chemistry Coding Blog Post

This project was all about the kinetic molecular theory. The driving question was “How can the behaviour of matter be explained by the kinetic molecular theory and the atomic theory”. To answer this question we had to create a simulator or game that shows the kinetic molecular theory, and has two or more atomic models. 

Before we could do any of that though we had to do our start mind map. Mine was mostly questions as I didn’t know much about this unit. Below you can see my end mind map which was just me adding and answering my start mind map questions.  

 After that we did a few experiments the eye dropper and gemstone 💎 experiments.

Then we started coding using a website called scratch. I found this a very fun and interesting part of the project as I got to learn to create games and simulators. By the end of the project I had created an scientific simulator with oxygen and water particles that change states. Even though it is a little glitchy I am very proud that I created it. Below is the scratch code that i used for one part along with my completed simulator.


Curricular competency’s 

Questioning and predicting: demonstrate a sustained curiosity about a scientific topic or problem of personal interest.

The start mind map was where I best showed my curiosity on this scientific topic. During the creation of the start mind map I was thinking about what I needed and wanted to know about this project, showing my curiosity. 


Scientific communication: communicate ideas, findings, and solutions to problems using scientific language representations and digital technologies.

I think that this was the competency I did my best on. I showed it in my simulator when I made it so the particles are always  moving, when I made it so the particles change states with the temperature, and when I showed both oxygen and water particles.

Reasoning and analyzing: use logic and patterns to
solve puzzles and play games. 

This competency was showed when I created the code for the simulator. I had to find out what each line of  code did and figure our how I can make it do what I wanted. I used logic to make it so when someone changes the temperature/pressed a button it changes the state and speed of the particles. It seemed at times that my code was broken and I used logic to fix and improve it. I also helped some of my classmates understand how to use scratch to better improve their simulator.

So after all of that I think I am really to answer the driving question “How can the behaviour of matter be explained by the kinetic molecular theory and the atomic theory”. Matter has three different states the kinetic molecular theory explains that when heat is added to matter it changes states. This has been a fun, hard and interesting project it made me think about how I want to learn more about coding in the future. I also learned that I work well collaboratively. This project was a very enjoyable way to learn science.

The More Things Change.


The more things change is the name of my project. This project was 5 milestones long and it was about Europeans setting in Canada our driving question is “How did European settlement effect all the people involved”. To answer this question we had to create an infographic. This infographic was then put up somewhere around the school. We also made a video explaining the infographic you can watch this video above. 

For this project you were partnered up with another classmate for the last three milestones, my partner was Nolan. 

The first two milestones were relatively simple. We had to write a reflection on how deep cove has changed, and complete a chart about continuity
and change in the time of European settlement.

The next three where more based on the final product an infographic that answers the driving question these were also the milestones that we worked on with our partners. Milestone three was when we had to come up with one fact + graphic for each of the three groups involved in the European settlement.

The three groups are…..

  1. The British 
  2. The French 
  3. The First Nations 

We also had to write a thesis that answers the driving questions and connects to the three facts.

The teachers then gave us critic on our facts and graphics and we revised them
for milestone 4. Milestone four had multiple tries and versions. This milestone
was our final infographic with the three facts + at least three graphics, the thesis, the statement on continuity and change, and at least three sources in
alphabetical order. We handed this then into Showbie got critic on if fixed what we needed to then got more critic we did this multiple times and in the end we  had finally made an infographic that makes sense and answers the driving question.  

You might think that that’s the end of this wonderful project but its not we then had to create a YouTube video that shows and explained the infographic. This video was made in an app called keynote with a thing called magic move. This video is showed at the top of this post.  

This project also included two curricular competencies I showed the first competency (identifying continuity and change) in milestone 2,3,and 4 as all of them included me identifying and writing about continuity’s and changes during the time of European settlement. The second competency (Using evidence from various sources )was showed in milestone 3, it was showed in milestone three because that is when we had to make our three facts, we had to know if our information on the fact came from a reliable source or not and to make sure we show where we got our info. Over all I think I ☀️accomplished☀️ all of the curricular competencies. 

That brings us to the end of this very fun and interesting project I learned a lot about what European settlement was and how people were effected.

Argh Matey Blog Reflection.

 Hi. This blog post is an end of project reflection on a project called Argh Matey! This project was all about the European exploration of the new world! During this project we had to learn about Christopher Columbus with his “discovery” of the Americans, we had to learn about the Columbus exchange, and much much more. In this project we learned about cause and consequences, both the cause and consequences part of the project and the European exploration part were put together to create the end project.   

Before I tell you about the end project I need to explain how we used an app called AR Makr to put together the end project. This app is an augmented realty (AR) app this makes it so you can add 3D or 2D shapes to a room to make it look like it is actually there when you look at it in the app. 

Now combining the three things I have talked about, I made an AR video on the European exploration using cause and consequence! I made a cause and consequence sheet on the European exploration, created drawings for each event, wrote an paragraph explanation, and then I added it all into the AR Makr app to bring it all alive. For example, I brought a boat from Christopher Columbus’s time and also some indigenous people. This showed the Columbian exchange and the start of European exploration of the Americas.

 I enjoyed making the end project even if there were a few problems like the AR app not saving my progress, or the fact that my writing explanation took forever to record. Over all I enjoyed how we put our learning about the European exploration into a new app.  I hope you enjoyed learning about the Argh matey project.

My first experience with DI

Hi for the past few weeks i’ve been working on a project that has been both fun and stressful, this project was called destination imagination(DI). For this project we were put into groups and in those groups we tried to find the solution to the problem assigned to our group. We filled out a survey saying what group we would and wouldn’t want to be in. The groups we could be in were….

-engineering: where the problem we had to solve used engineering 

-technological: where the problem we had to solve used technological thinking 

-scientific: where the problem we had to solve used scientific thinking 

  • fine arts: where the problem we had to solve used fine arts 

The group I said I wanted to be in was engineering and I got what I wanted. I was put into one of the two PLP 8 engineering teams. There was two engineering teams one with each of the humanities teachers. You might want to check out some of my teammates blog posts for DI:

Ines


Alfie

Samuel

Gwen: http://www.blog44.ca/gwenl

max: http://www.blog44.ca/maxl

Mateo: http://www.blog44.ca/Mateok


For our solution we had to build a model of a building showing how opposites can be complementary. We had to include one visual art style and one architectural style. We chose to do Renaissance and post modernism for those. We also had to include 2 style features and two visual art styles. 


Our visual art styles were the roof and the shape of the building as it represented post modernism and our style features were the Renaissance themed furniture and paint. Along with all of that we had to come up with a story around the model of the building to again show  how opposites can be complementary. Then we were to hand in the video showing our solution. For the skit we chose to act as people of all ages from an old grumpy person to a youngster and we even had a millennial. We did this to as another way to show how opposites can be complementary. Here is our video!

Even thou I know that this video isn’t as good a it should have been I know that I definitely learned a lot during this project. I learned that it is very hard to work together as a group on projects like this. I learned that DI takes a lot more patience then I first thought, and that time management is more important than you might think.  Lastly I also learned that DI takes up a lot of time and a lot of thought. Overall this project was very interesting!