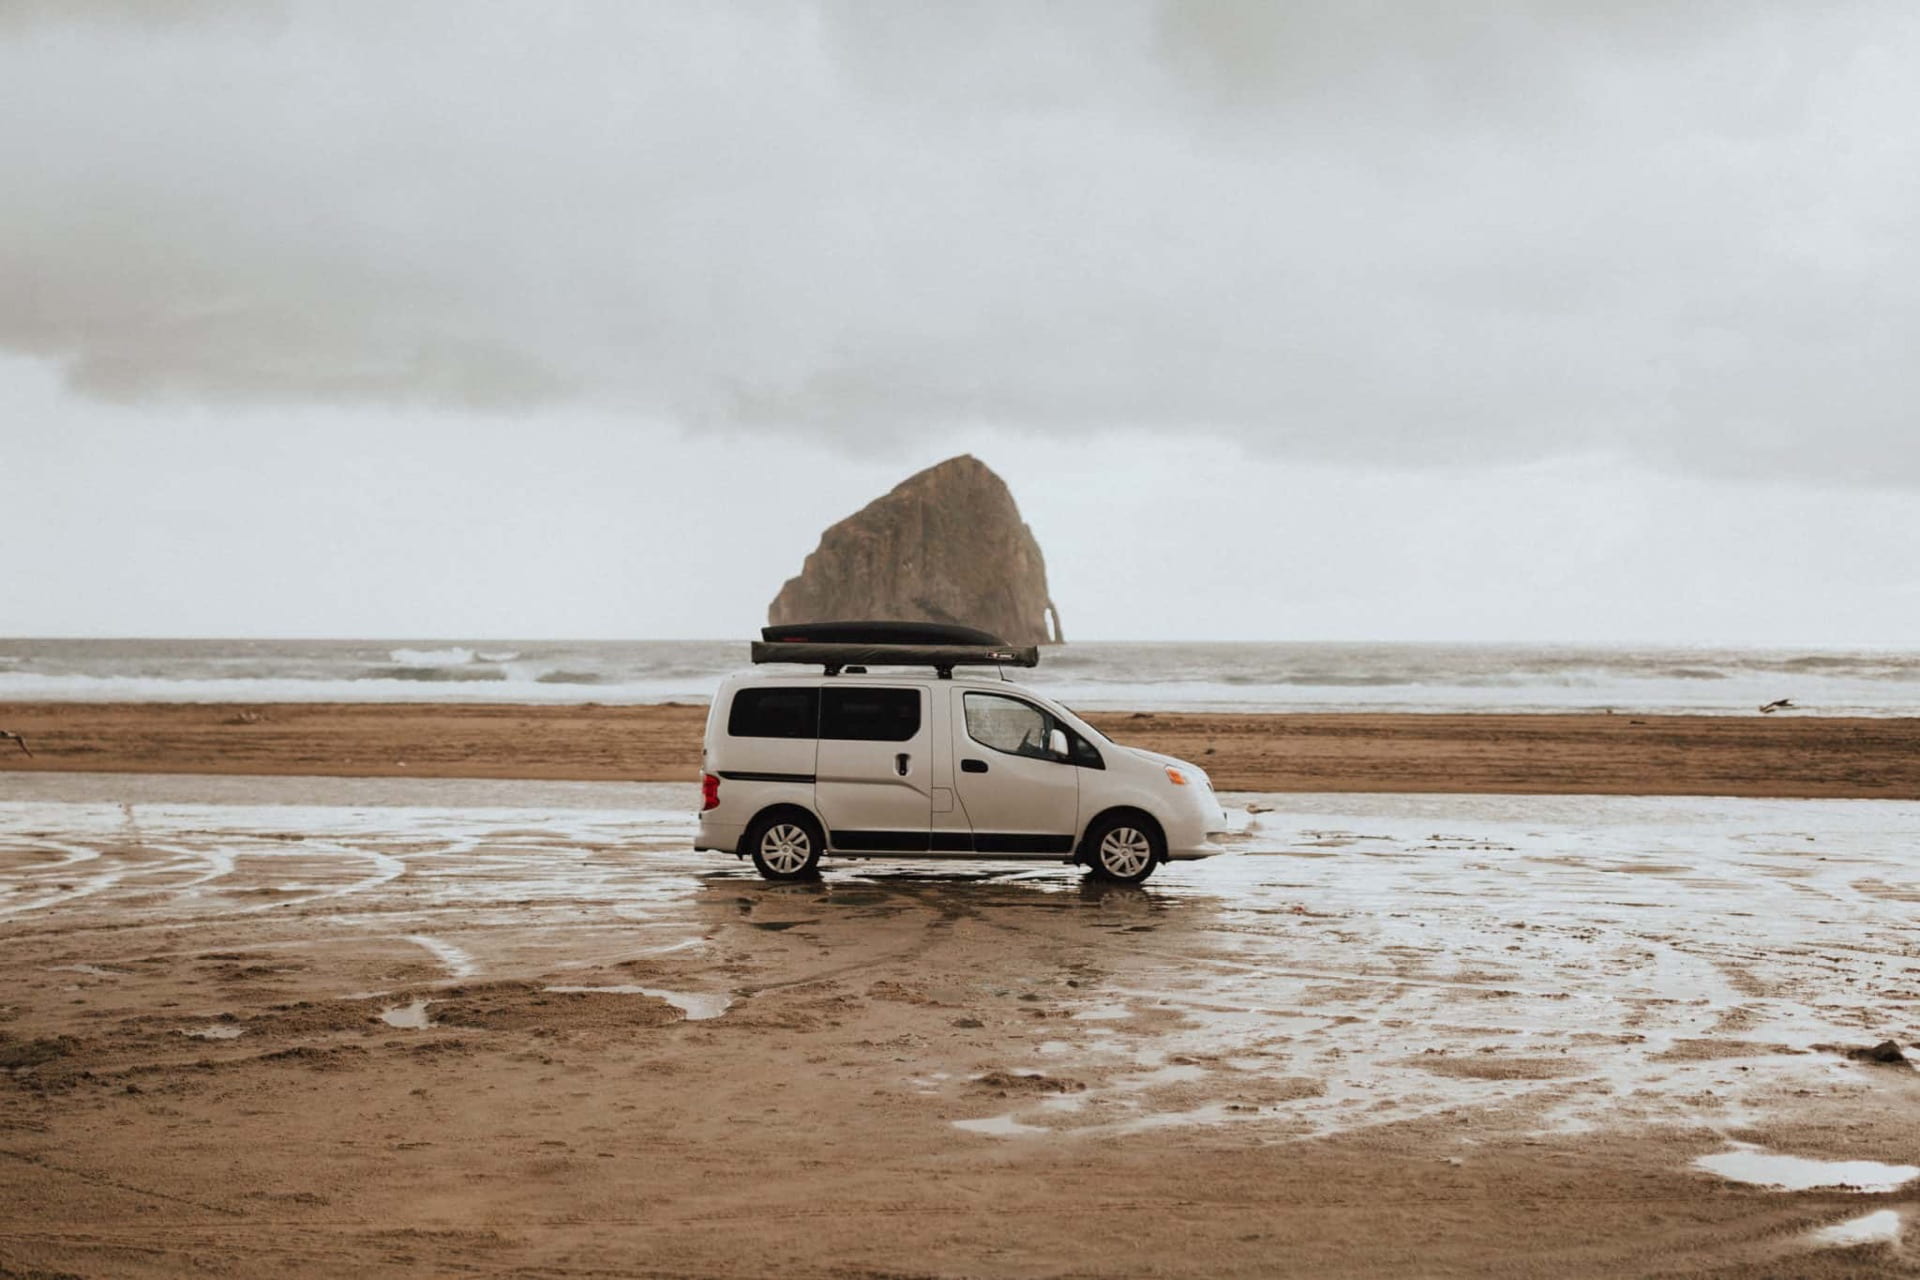
A dream come true I would say. Ever since I moved from California in 2012 I have always wanted to take a trip down the west coast. Surfing has always been an interest of mine and being able to surf everyday at some of the best surf spots in the world would be amazing. In this project we got to to do just that. Well almost. The Ultimate Road-Trip combined math and science as well as our dreaming capabilities to plot out a road trip with ta budget of $10,000. The project was led by the driving question: How might we model changes over time?
The first competency that we visited in this project was Reasoning and Analyzing: Estimate reasonably. For this competency we were asked to make a spreadsheet in Numbers that details our budget for the trip. We then had to make sure that our grand total cost is between $9500 and $10000. Although this milestone was quite time consuming, I found myself enjoying every bit of it. To start off the project we were asked to choose our road vehicle and to state where we would depart from. We also had to record the cost per night of the vehicle. Once we had that information, we needed to build the math knowledge for the project. We learned all about linear equations, graphing and how we would present our project. Although I felt ready to start graphing, I still needed to find the objects that I would use my $10,000 on. After in found the objects and thief costs, it was finally time to plot them down on the chart. I thought that I understood this competency and even extended my knowledge for the milestone by adding the percentages of the total cost each item had. After I completed the chart and I had all of my totals, it was time to create our final product.
The next competency in this project was: Communicating and Representing: Represent mathematical ideas in concrete, pictorial, and symbolic forms. This competency led us through the final stages of the Ultimate Road-Trip. Finally, with all of the mathematical knowledge we had learned in mind, we created a linear formula that would be shown on a graph. We used 2 totals that we found to create the formula (y=mx+b). For this stage we used an app called Desmos which made everything much easier and understandable. All we had to do was punch our totals into the equation and the app would make the graph. Well… it wasn’t as easy as it sounds. I immediately found myself struggling to make the graph change in any way and the app was telling me that my formula was invalid. I tried and tried again until finally, the lines on the graph moved. I thought I had succeeded untill I relized that the y-intercept was completely off. I came to the conclusion that I had done my original calculations incorrectly. Finally, after I re-did my calculations multiple times, I checked the y-intercept and it worked! I have too say that this competency was where I showed the most growth through this project.
Overall I can say that I enjoyed completing this project and although I had my ups and downs, I answered the driving question through my end product. Not only have I learned tons about linear relations, but I can now say that I am ready to embark on my Ultimate Road Trip. Thank you for reading and make sure to comment any thoughts or questions you have on this post.


Ryder.. great project. My one question for you. Do you need a chauffeur for your trip? Keep up the great work.
G-pa
Hi Gpa,
A chauffeur would always be nice. Thank you!