Cause Vs Correlation
For the past two weeks, we have been working on a cause and correlation project. If you don’t know what cause and correlation then here is a brief description.
Correlation and Causation
We did a lot of lessons on the subject before starting out the project the first thing we did was analyze graph to see is correlation implies causation. As mentioned in the definition above the correlation does not imply causation.
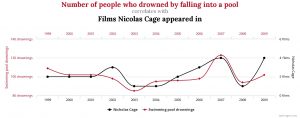
We looked at a graph like this which shows a correlation. As you can see the numbers on the chart go up at around the same time.
We also looked at charts like this which show a causation. The number of cigarettes consumed by men each year and the number of lung cancers death in men. Cigarettes have been proved to cause lung cancer so if you smoke too many the number of lung cancers deaths will go up.
TED talks
I love TED Talks I’ve always found them very interesting. In class, we watched a TED talk called “The best stats you’ve ever seen”.
The presenter in the video was Hans Rosling and he used a tool called Gapminder to debunk several myths about world development. It was a really great example of cause and correlation.
Hand size and Hight
Does hand size have a correlation to hight? In class, we did an experiment to see. Everyone in my class measured each other’s hand and hight and used Numbers to enter our data.
After gathering the data and putting it into a chart we found that it did indeed have a correlation. Taller people seemed to have bigger hands. Now that you know the sizes of the people in my class feel free to get them a nice sweater or a pair of gloves.
Starting the project
On day four of this unit, we started the project. The first thing we did was get a partner. We were allowed to choose our own partner so long as it wasn’t someone we had worked with in the past. So my friend Melika and I did our project together.
The next thing we did was brainstorm two driving questions. The example we were given was;
“Does _______ have a correlation with ______?” and
“Does ______ cause ______?”
The questions we came up with were, “do mangos consumed per week have a correlation with hours of music listened to per week?” and “Does drinking mango juice cause insomnia?”
Next, we made a poster with our questions on it so we could do a gallery walk. We walked around and wrote feedback on everyone’s posters. This helped Melika and me to develop our questions further.

After creating our driving questions we created a project plan. We decided what tools we were gonna sure to collect and present our data. We chose to use Numbers to collect our data and Keynote to present.
(something)
For our correlation question, Melika and I decided to survey the grade 9s at our school. We went around and asked them our questions and we put the results into numbers.
After we got all our data we had to put it into a graph and calculated the mean, median and mode.
The results of our graph showed that the people who eat more mangos tend to listen to less music while the people who eat fewer mangos listen to more music.
The only problem with this was that it didn’t really follow a definite pattern. It only correlated a small amount. Other than that this part of the project went really well.
We had to think about the communication core competency when doing this part because we had to communicate with our classmates and others in our grade. Melika and I also had to collaborate as it was a partner project.
For the mean, median and mode we had to use the thinking competency. We had to first calculate then find an interesting way to present it.
Presentation
Next, we used keynote to create our presentation. We used keynote collaborate so we could both work on it. This gave us a chance to work together and implant our ideas. Working together made it personal and it was a mix of both of our styles.
Im very proud of our overall product. I think this project went really well. If I could change some things it would be the causation part of our project because we didn’t actually have time to do the experiment and that affected the end results. Overall though I think everything was great. Our presentation went well and our correlation data was pretty great!
Until next time!
-Jessie🌈


