Category Archives: Individual Project

Let’s Reflect Post

Hi everyone, today for Day 11 of the student blogging challenge I will be looking back at the things that I was proud of. Also, I will be telling you guy my blog plans for the future!


I will start by saying that this challenge really helped my blogging skills. For example, I learned the importance of media and visual. Aspects, as well as the importance of Tags and Categories.

The weeks that I feel that I learned the most from was the Embedding content Post from week 3 and the Emojis post from week 7.


The embedding content post helped because it taught me how to add links, rename them, and add YouTube videos. The reason it was so important to learn is because adding links/media will be important for me in the future. Also, adding visuals to show my work is one of my current goals so it was important to add that aspect to my blog.


As for the Emojis post, it helped me with my creative thinking skills because the goal was in the post was to create a story using emoji prompts. It was important because it gave me a chance to work on my story telling skills. Also, in relation to DI, a project that we are currently doing, the post was all about creating a story within the emojis that you got.


Now to my future blogging plans, I think something that I want to start doing is doing like a weekly review of something. Also, I want to continue to write about my interests and different cool stories that I have for you guys.


We got a certificate at the end of the challenge so here is mine!


Thanks for reading!

How it started, How its going Post

Hi everyone, today I will be writing about the project that I have recently been working on in PLP 8.

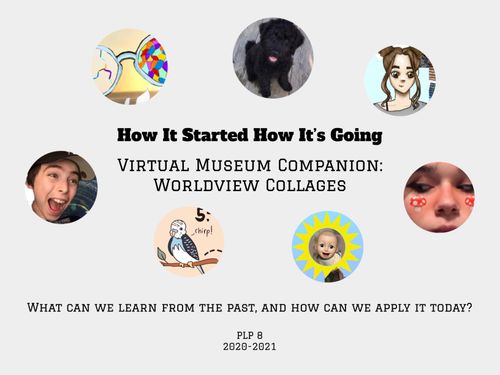
This project was called “How it started, How its going”. It was inspired from the popular meme from late 2020. 

Here’s an example:

  This project was all about worldview and Historically significant events ranging from the Medieval times to the Renaissance. Also, it was about connecting those events to the modern day western worldview.

The driving question in this project was “What can we learn from the past, and why does that matter to us today?”. My answer to that question is: that we can learn about things that shouldn’t happen again, as well as things that forever changed the way we think today.

To represent my learning, I will be highlighting the milestones/stepping stones, that helped me answer the driving question best.


The first thing I will be highlighting is Cornell Notes. Cornell notes are a way to take notes that help you to cue your understanding of the learning and summarize that understanding into your own words. Here’s a link to explain more about Cornell Notes: Cornell Notes Video. These notes helped me with other assignments in this project, such as Milestone 3 where we wrote a test answering the main question: What Historically Significant Events Helped Develop Our Worldview? This note taking technique will also help me in the future for note taking in different classes. 


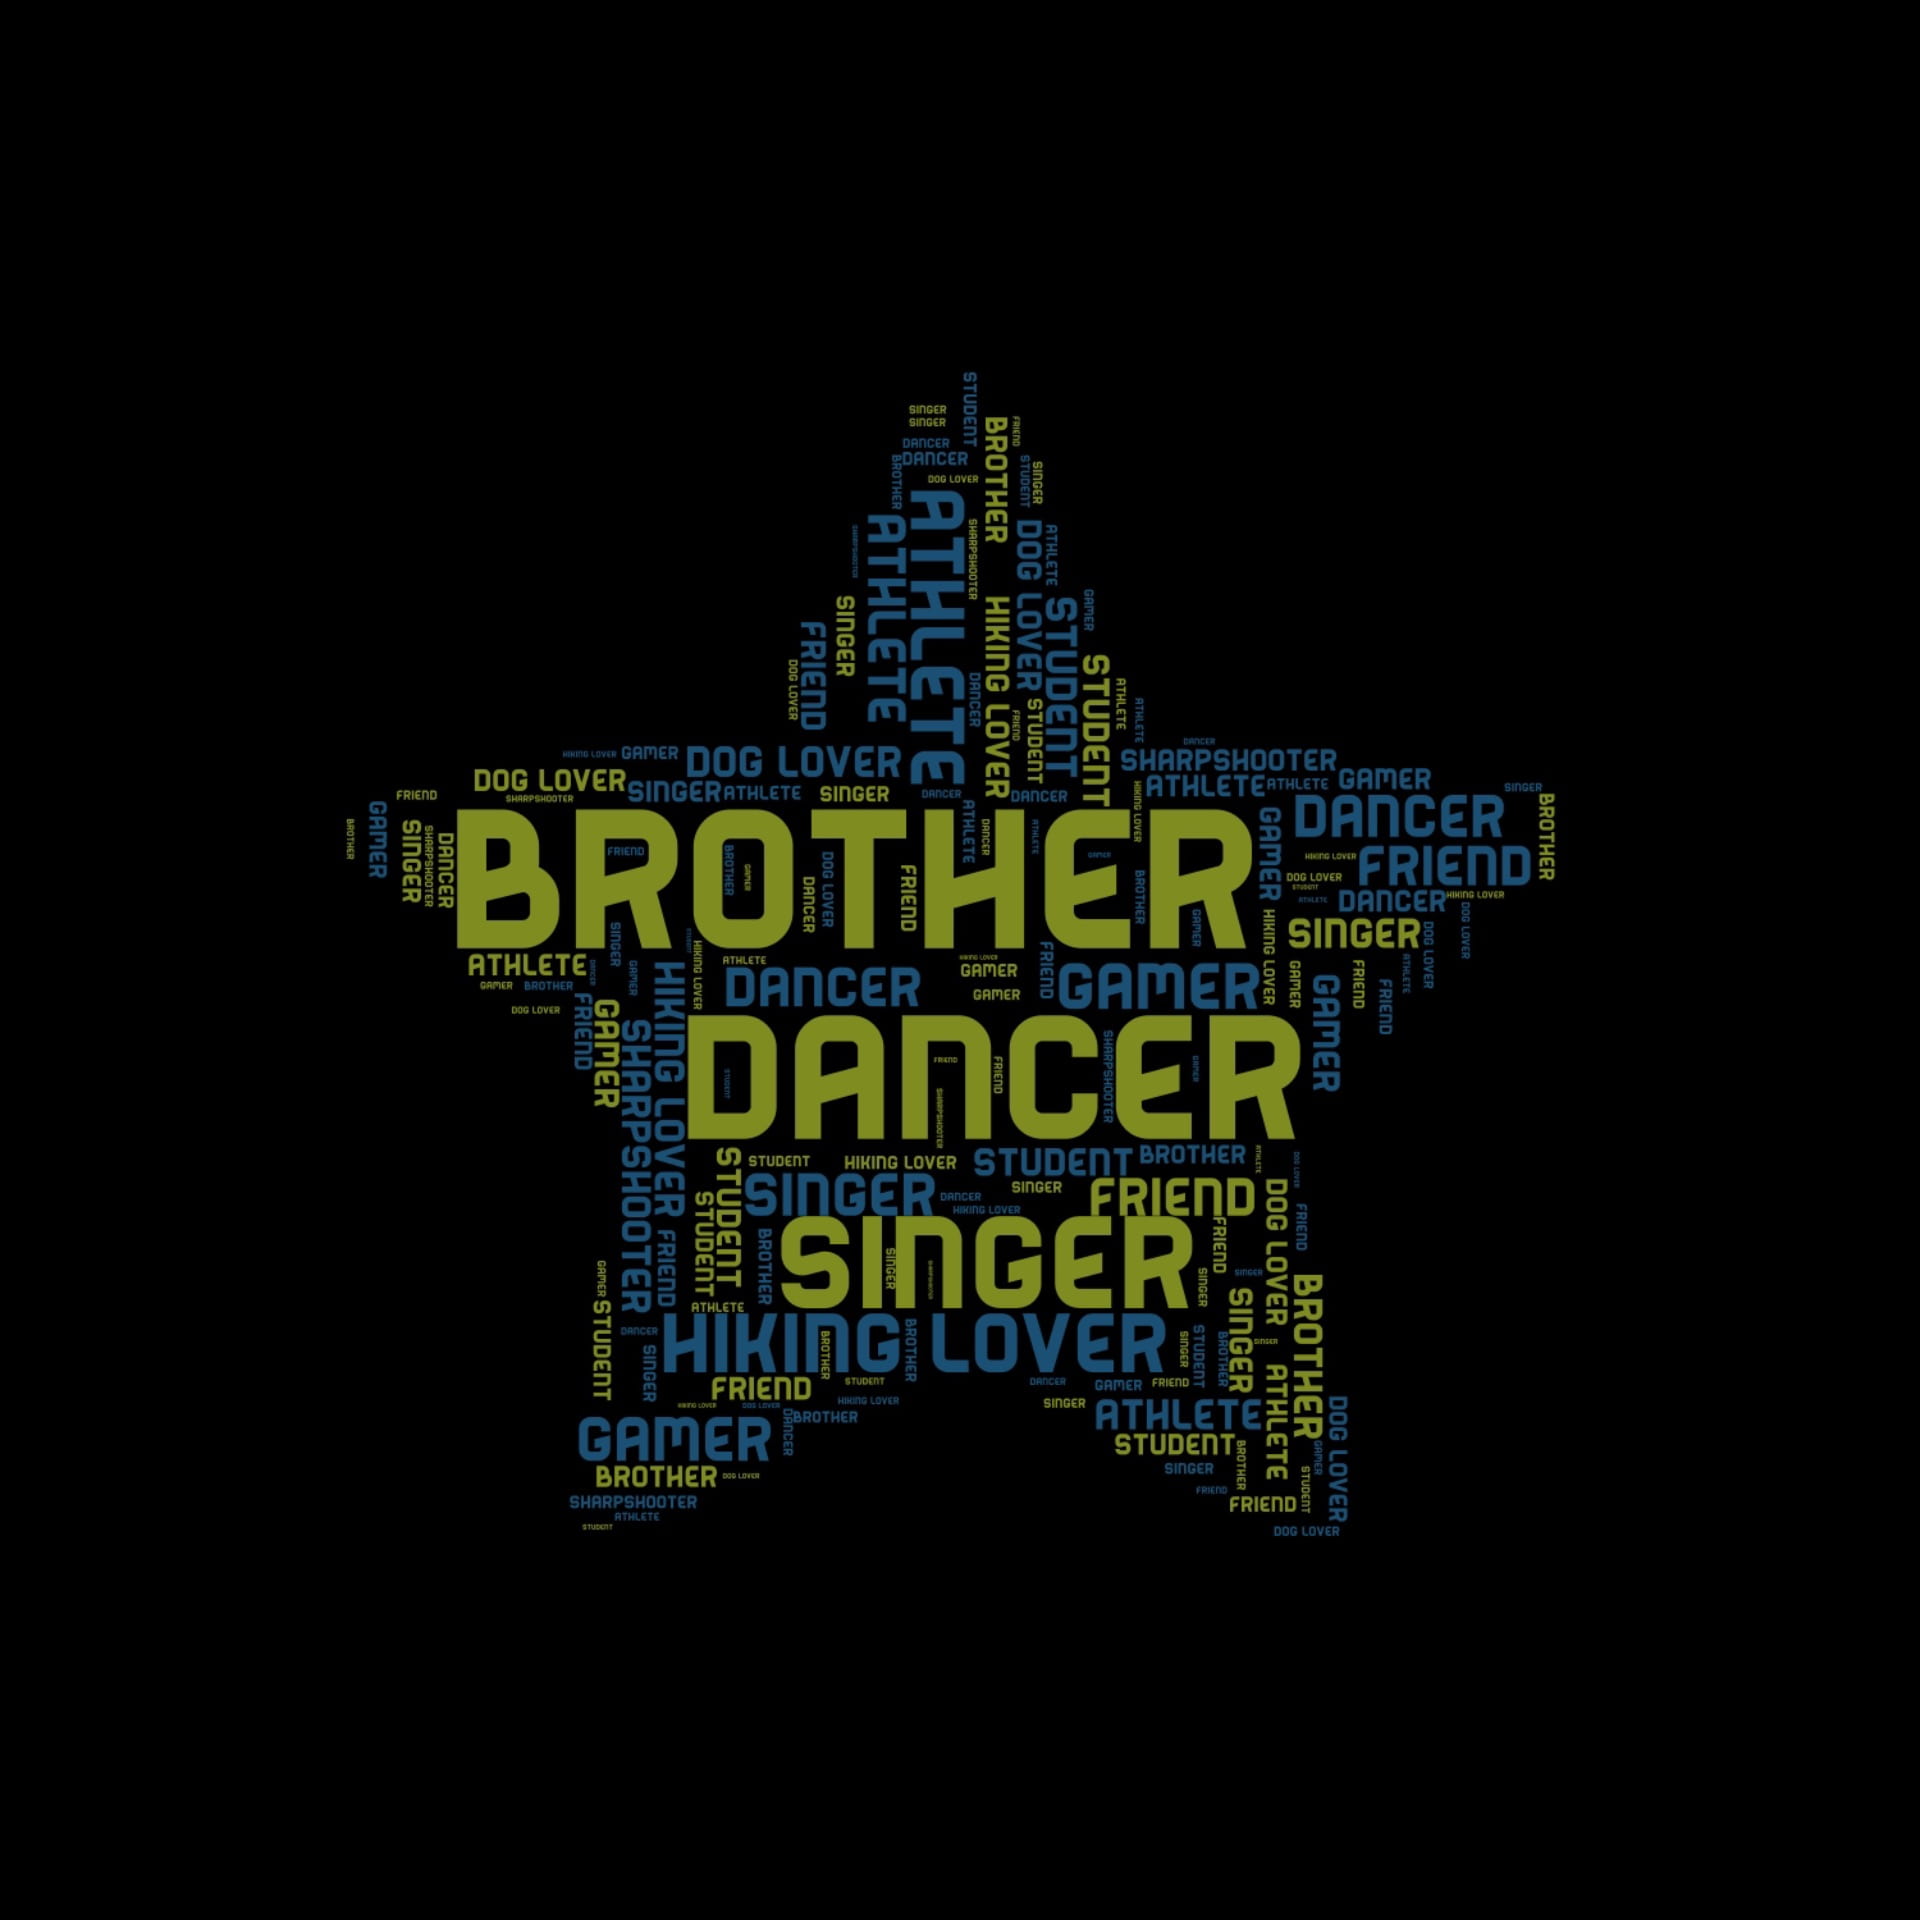
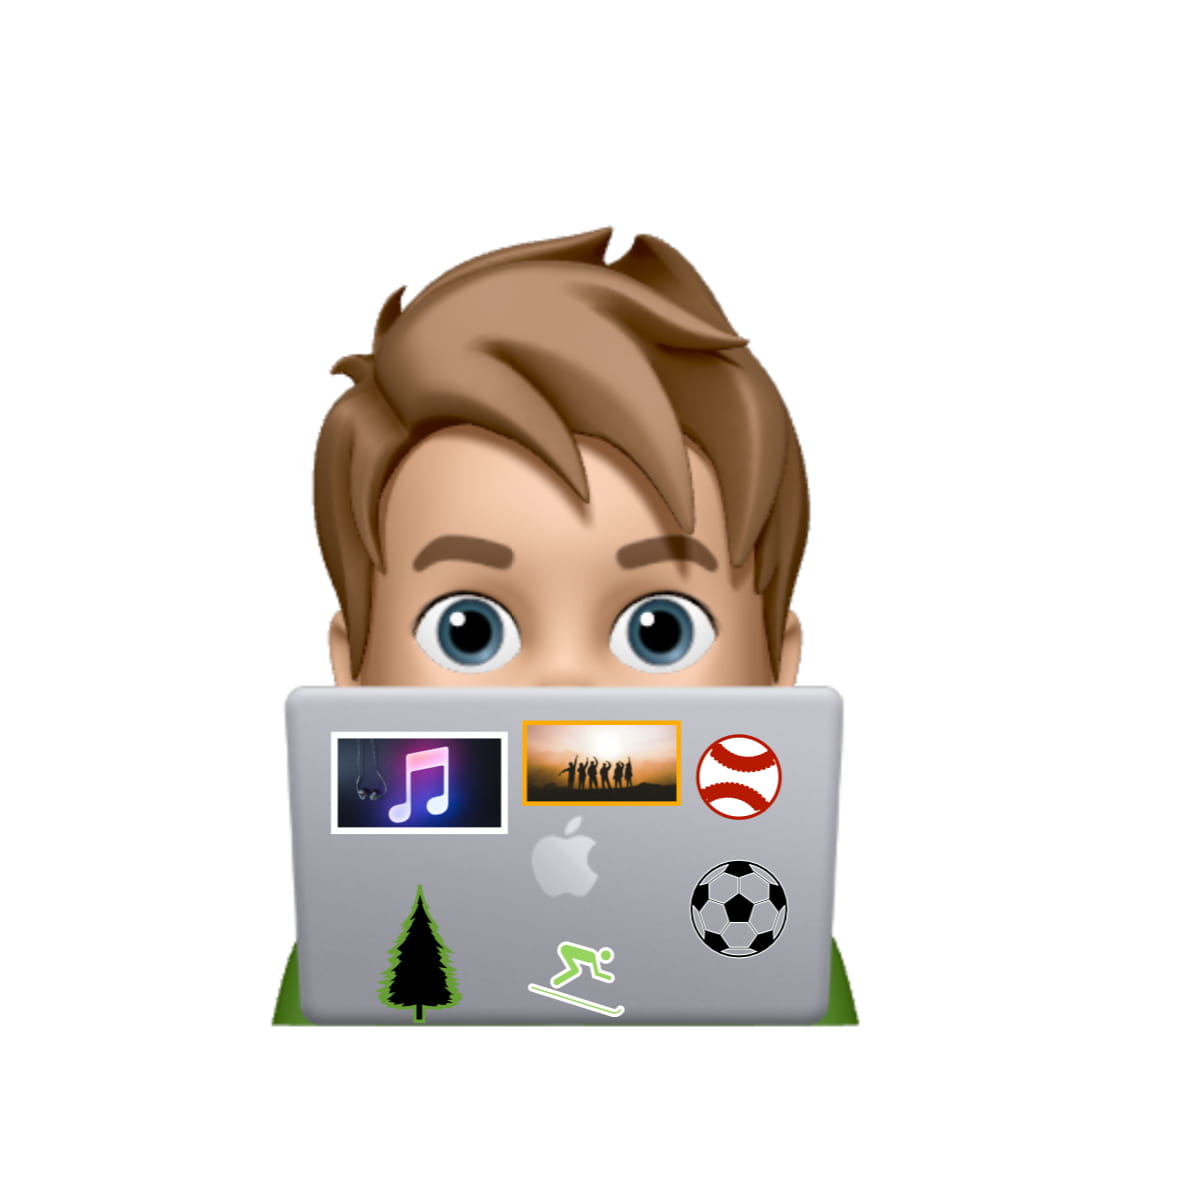
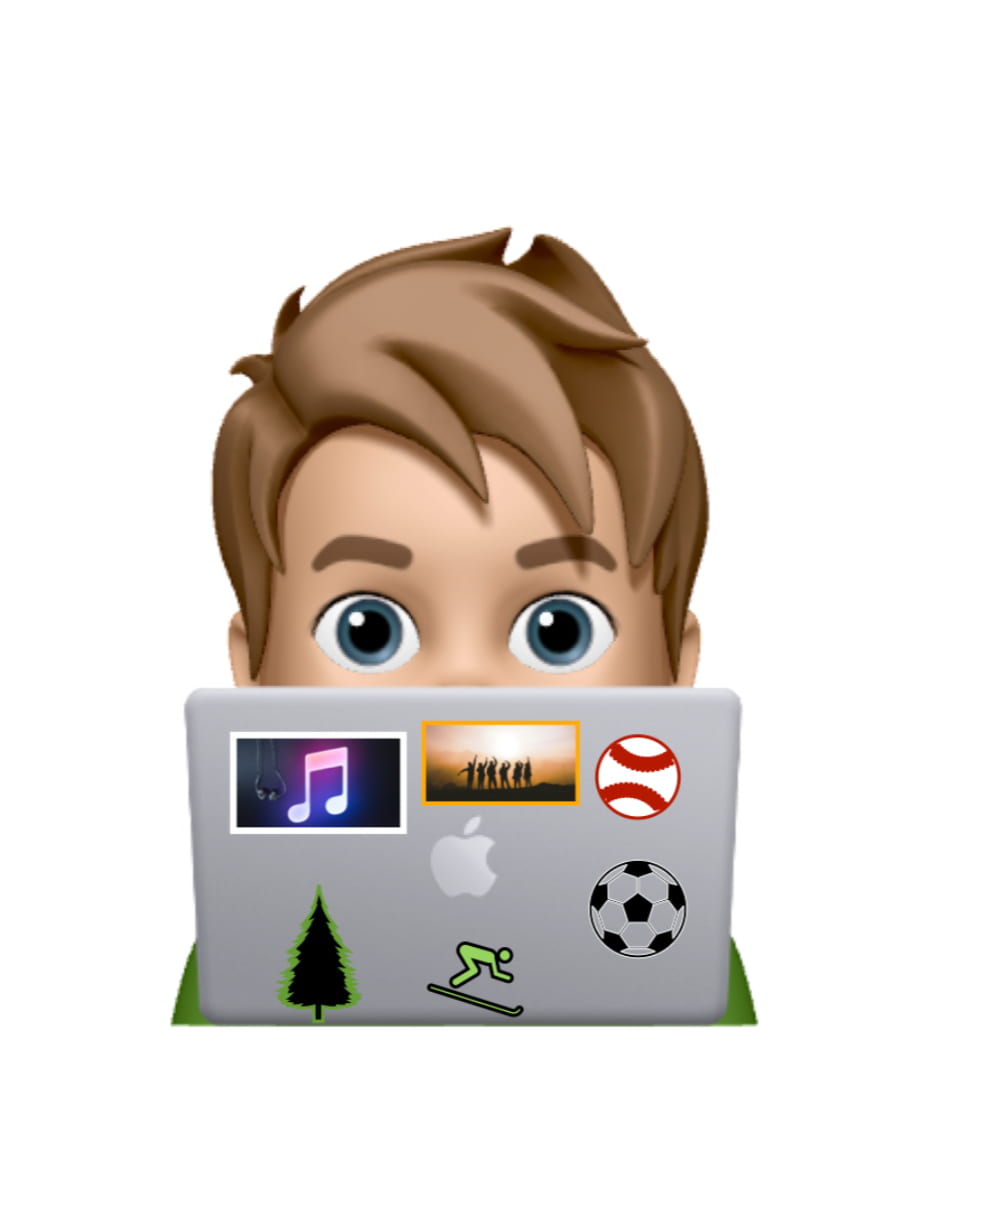
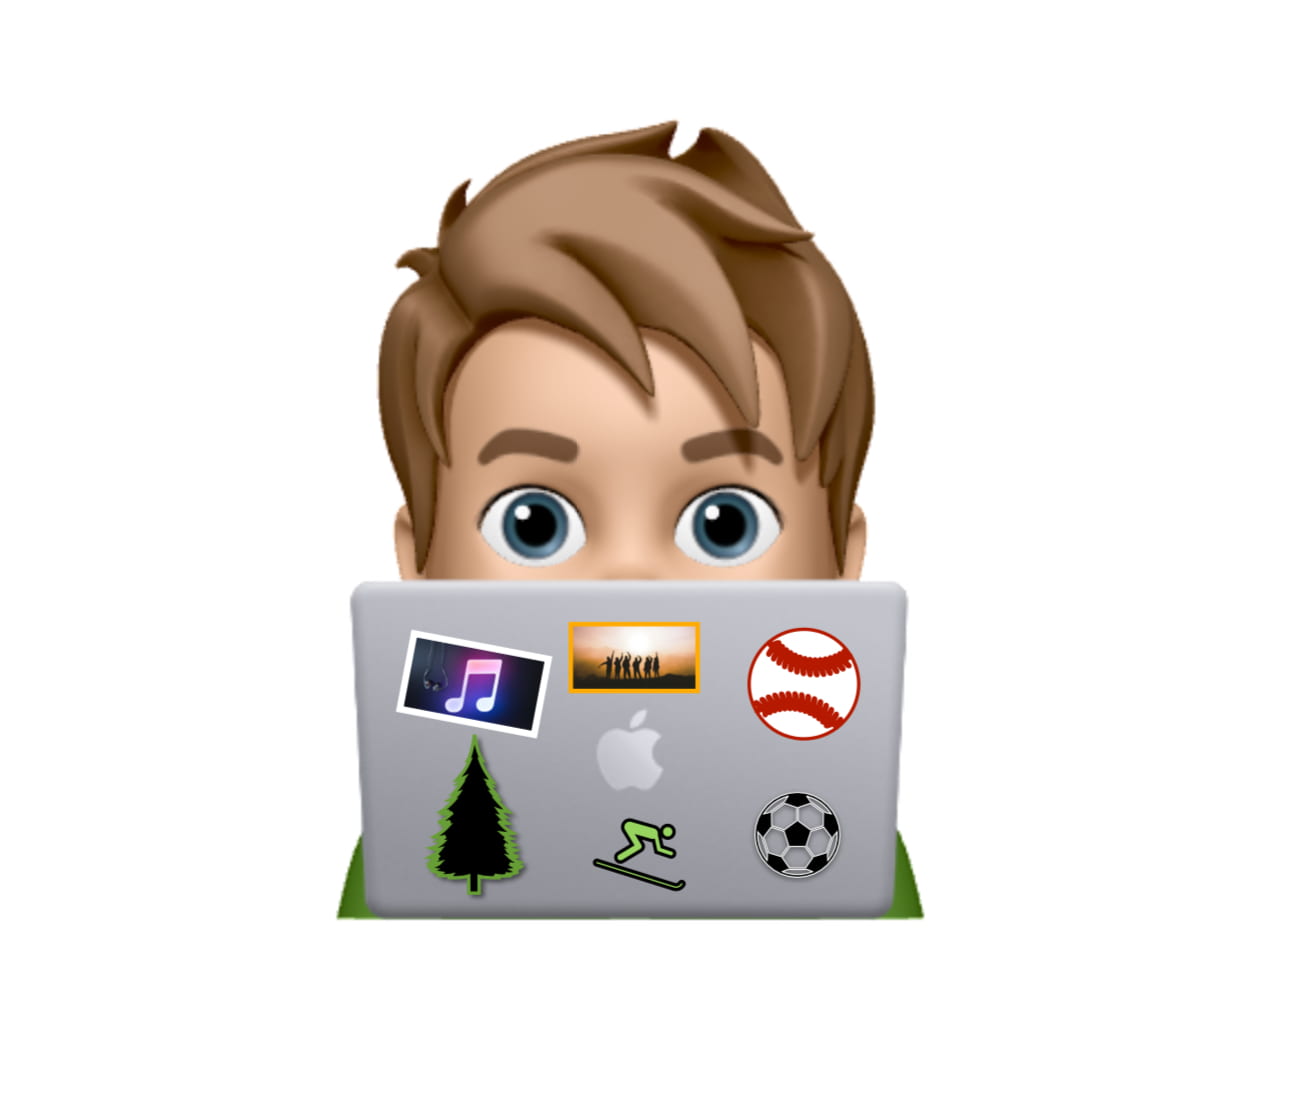
The second thing i will be highlighting is Milestone 2. The competencies in this milestone were: Responding to Text and Empowered Learner. I transformed ideas to create text by taking events from my life and organizing them into different categories. I used technology to appropriately and effectively construct my knowledge by creating my collage in Keynote.

In Milestone 2, we discovered more on Worldview, how worldview is identified, and how to represent your worldview. In further words, we created a collage representing our worldview, along with a supporting statement that explained our text. To get an idea of how to represent our worldview, we explored the story mountain. A story mountain goes like this: Exposition or Introduction, Rising Action, Climax, Falling Action, and Conclusion. This helped in teaching me how to better represent my worldview, (Which we would explore in other milestones).


The third thing I will be highlighting is Milestone 5 and the things that surrounded it. The competencies in this milestone were Responding to text, Establishing Historical Significance, and Empowered learner. I constructed a meaningful and personal connection between myself and the text by using a personal connection in my example. I assessed the significance of things by connecting them to the events of today. I used technology to construct my knowledge by using SuperimposeX to create my art.


Milestone 5 included our Art piece, in this art piece we first had to use a piece of art from the medieval or renaissance times, that represented historically significant people, places, events or developments from connecting to your aspect of worldview as ‘how it started’. Then for the “How its going” side, we recreated the piece we chose with modern day objects that connected to our worldview. 

Then to explain our art, we wrote an artist statement. In the exhibit, if you pressed our art piece you would hear our artists statement. To go see my Art piece, as well as my peers, visit this link:

PLP 8 Art Exhibit

Also to visit the Companion Exhibition Guide:

This milestone also included group work for the purpose of exhibit execution. There were 8 groups, each representing each aspect of worldview. 

There were also specific roles for the groups:

Writer, responsible for writing our guided tour for the exhibit

Art designer, responsible for adding the frames to art, etc.

DRI, made sure that everything was going smoothly

Room designer, responsible for adding artifacts to room 

Techie, responsible for technical parts of the project

Flex members, responsible for helping group members that needed help

I really benefitted from this group work because it is something that we will experience in our lives.

In summation, it was cool to do project that originated from a funny meme trend. Also, I liked how we learned about history and different historically significant events. An important skill that I obtained from this project was learning how to use the app SuperimposeX, for our how it started, how it’s going meme. In all, I really enjoyed this project and how we learnt many different aspects of learning.

Thanks for Reading!

Laser Laws Blog Post

Our final project of Quarter 2 was called “Laser Laws”. This project was about the law of reflection as well as learning about the Pythagorean Theorem. Like most projects we do in Scimatics 8, this project included some individual work, however the final product was made in groups. My group members were: cooperk/, samuelk/, lucap/. 

The driving question in this project was; “How can we test the Pythagorean theorem and the law of reflection?” There are many ways to test both theorems, however we did so in milestone 4 by combining Pythagorean theorem and the law of reflection into one experiment.

The law of reflection states that when a ray of light reflects off a surface, the angle of incidence is equal to the angle of reflection.

The Pythagorean theorem states that the sum of the squares on the legs of a right triangle is equal to the square on the hypotenuse (the side opposite of the right triangle). In other words, a+b=c.


Activities that helped me understand the driving question:

 Like most scimatics projects I’ve done, one of our first tasks was to create a “Project Start Mind Map” in the app “Mind Node”

Our task was to list all of the things we already knew as well as questions we had about the Pythagorean theorem and the law of reflection. The only thing I knew about light at first was the speed of light and didn’t know much else. Later in the project we went back to our “Mind Map” and tried to give an answer to each of the questions we had.


During this project we also did numerous experiments testing the Pythagorean theorem and the law of reflection. In milestone 3, we did an experiment testing only the law of reflection in our groups. We used a raybox, protractor, mirror, paper, and a pencil to conduct the test. Our method in this experiment was first to test the law normally, by projecting the laser from a certain angle to see if it reflects at the same angle, and it did. Then to further test it, we moved the mirror slightly to see if that affected the angle that reflects, and we concluded that the law remains true no matter how you alter the different variables.

In milestone 5, we created a laser display with mirrors and a laser. We got to create a shape of our choice and accurately planned and measured it. This experiment was fun at the end because all of the groups put their displays out and we used a smoke machine so you could see the shape the lasers were creating.

Here’s our display:


The Cirricular Competencies:

Questioning and Predicting: Demonstrate a sustained intellectual curiosity about a scientific topic or problem of personal interest.

We demonstrated this by working hard on what we were assigned and by focusing in class. During the project I don’t think I was as focused as I should’ve been on the task at hand during times, However, I did a good job at getting work done in class and avoiding homework.

Communicating and Representing: Represent mathematical ideas in concrete, pictorial, and symbolic forms.

We demonstrated this skill in milestone 4 by creating a right triangle with mirrors in the optics simulator. I first didn’t understand how to navigate through the optics simulator. I had thought we were testing the Pythagorean theorem and the law of reflection separately. I started to understand when I asked for help from a classmate and I started going in the right direction. 

Here’s what I created in the optics simulator: 

Applying and Innovating: Co-operatively design projects.

We demonstrated this by creating our laser display in milestone 5. I think that I personally contributed a good amount of effort into our display. However there were times where only 1 or 2 people in the group were actually contributing.

In conclusion, I learned a lot about light, how it reflects, and also about the Pythagorean theorem. I most enjoyed creating the laser display because seeing how cool it looked with the smoke machine was worth the work. However the hardest part of this project was exploring all of the different vocabulary words in the workbooks an being tested on our knowledge of them. In all, the best thing about this project was exploring scientific concepts as well as Mathematical concepts. 

Fractions of your Time Final Post

Hello readers, for the past few weeks in Scimatics 8 we have been working on a project called “The Fractions of your Time”. The goal of this project was to track our screen time and to also get a better understanding of what we do every day. We tracked our screen time from Wednesday the 18th, to Tuesday the 24th of November. 

The driving question in this project was “What fraction of our time is screen time?”. For me, the answer to that question is that three tenths or 30% of my time is screen time.

The milestones that helped me answer the question and create the final product the most are milestones 2, 3, and 6. 

Milestones 2 and 3 were both quizzes about adding and subtracting fractions. They helped by giving me a chance to re-devollop my fraction skills, also by helping me to calculate the data in the power sheet and for the pie charts we made. 

Milestone 6 was were we presented to the class our final product and explained what each pie chart displayed. This milestone helped me by giving me a chance to see my peers ideas as well as showing me what I could do better. Furthermore, the milestone helped by showing me how I could bring my work to the next level.

Here’s what my screen time spreadsheet looks like:

 After seeing my classmates spreadsheets, I realized that mine was a lot different. For example, I didn’t include productivity hours on my iPad, and didn’t really have any personalized sections.

I wasn’t really surprised with the data because I know that most of my iPad time is for school, and that most of my phone screen time is my sister going on Tik Tok.

Also, here’s a link to the full version:

https://www.icloud.com/numbers/0o-Oe-Vb6aFwpE_kkj_SYvkSw#Screen_time_Tracker_2020

Here’s the graphs that I created:

 The chart on the left displays how much of my time is spent off screens and how much is not. The chart on the right displays how much of my total cellular based screen time is spent on iPad as opposed to iPhone.


The chart on the left shows how much time I spend sleeping against how much I spend doing excersise. The chart on the right shows how much time I spend on TV as opposed to console gaming.

 This chart demonstrates how much time I spent on screens each day.


 This chart represents how much time I spent on each category throughout the week.


The 3 Curricular Competencies in this project were: Applying and Innovating, Understanding and Solving, and Communicating and Representing.

Applying and Innoavating: Contribute to care for self, others, community, and world through individual or collaborative approaches.

This Competency was excersised by using class time efficiently and by getting work done on time. My achievement on this competency showed development because in the past I wasn’t as efficient in getting things done and got distracted easily. I think that during this project, my level of concentration has just gotten better and I feel that I have grown a lot in this competency. 

Understanding and Solving: Vizualize to explore mathematical concepts.

This competency was shown in this project by doing math worksheets, as well as small class quizzes. My achievement on this competency shows devollopement because I regained my fraction skills in this project and devolloped a better understanding of adding and subtracting fractions. I feel that this competency was most helpful in creating the final product because the main part of this project is adding and subtracting numbers to get data.

Communicating and Representing: Represent mathematical ideas in concrete, pictorial, and symbolic forms.

This competency was excersised in this project by creating charts and graphs to represent our data. I developed in this competency by seeing what others created for their graphs as part of the class presentations. That really helped me in taking the next step and improving my work, as well as discovering what more I can do with my iPad. 


In conclusion, I really enjoyed this project and I found it interesting to track my personal screen time. It was also good to further enhance my iPad skills, as well as getting a better understanding of numerous apps. Furthermore, it was good to experience a project with numerous mathematical concepts in it. In all, this was a great project and I can’t wait for more like this in the future!

My User Manual Reflection

The first Project we were assigned this year was all about creating a User Manual of ourselves. The driving question in this project was ‘How do I creatively communicate who I am’ and at first I really didn’t know what that meant. We followed the driving question in different ways leading up to the final product.

The first stepping stone was about writing things that define us, and we later took those notes and made them into our own ‘Word Pack’. Here is my ‘Word Pack’:


Our next Stepping Stone in this project was very similar to the first Stepping Stone because it was also about what defines us. We had to take 3 traits from our ‘Word Pack’, however in this stepping stone we described ourselves in photo format. For my 3 images I chose Athlete, Dancer and Friend, and this is what I created:

After those 2 activities we started our User Manual Outline which was our first draft, but in point form. I ended up writing 3 different drafts making little tweaks along the way. And each draft that I wrote looked completely different. And something that I really benefited from in this stage was when we did our first Peer critique.

My User Manual Final

For this Final draft I changed The font size and colour and practically re-modeled my Acessibilty paragraph and my Settings Paragraph. And one of the big reasons I did that is because my main spot of improvement was finding words that fit well together. One of the big things that I learned from this project was that there is no such thing as a Perfect draft because when I looked back and read it all those times over I could really find the little things that I could fix to make it better.

Another thing that we created in this project was our own Memoji Laptop. We had to take our personalized Memoji, and put stickers that represent us on a laptop. 

This was my first draft:


I thought it was a pretty good first draft, during our class peer critique there were  people wondering what my different images meant and also someone recommended that I add more shadows. So I followed with this draft:

I thought it looked better than before, I had all the right images layer down so there wasn’t any concern with that. I added darker colours to the outline so they looked more like stickers.


v

For this draft I was even more satisfied because I had made the stickers bigger, more visible and I had also followed up on a idea from peer critique to tilt one of the stickers.

It looked perfect, represented me well and I thought it was my best work.

In conclusion, I really enjoyed  creating the Memoji laptop and describing and discovering who I am. Something that I will take from this project for future references is all the other tools and apps that I learned to use. And it was really helpful to receive critique from my peers.