Math
Math Project: My main project for Math so far was My Door is a Bore (Surface area an volume).
My evaluation of myself in math is that I seem to understand concepts relatively quickly and beIng good with operations. I forget some things but I seem to remember most times by skipping the question and coming back to it after. I’ve always found an interest in math so I will work better or put more effort into it.
During the project we worked in groups of 4. We divided our work quite well and put our skills in places we had more experience with than the others in our group. I was more of the person who was calculating numbers in my head and drawing and measuring our shapes.
What I should probably improve in this subject will be make a habit of studying before quizzes or tests because soon I’ll be encountering math that will not have such an easy solution as to skip the question and come back to it.
Science
Science Project: My main project for Science so far was Kinetic theory of matter (iMovie video what it is).
Below is the video I made with my partner Caleb. We had a problem were some pictures and audio recordings were deleted and so you’ll have sections with a black screen with audio or a picture/diagram without audio except for background music.
We’ve covered one area in science so far and our project was to make an iMovie about it. You cou draw a diagram or make a little video represention (little act, stop-motion, experiment, etc.) to make an educational video. Ideally you had to pretend whoever was watching it didn’t know anything about the subject so it had to be simple. I mostly enjoy science and that’s a plus for me because it assures I will put effort into it. Besides I’m currently thinking of being a doctor (surgeon) after university so science and chemistry helps.
Science, being so related to math has me constantly developing applying skills that are useful in both subjects like volume calculations and distances.
I could probably improve my researching skills as most of the things we’ve done so far need to find information for worksheets or assembling and organizing information properly.
Humanities
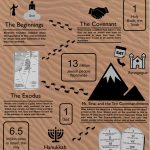
Humanities Projects: Main projects have been our Advertisements, our Worldview videos and our infographics.
I’ll start of saying that’s procrastination has been a big problem because, unless you’re really crazy (at least in my opinion), watching YouTube videos or following your favourite sports team is a lot more fun than homework and school, and doesn’t require work.
I got quite frustrated at times when making our ads because no matter how good or bad your first ad draft, you were going to have to make ten drafts. I actually liked the experience and marketing skills might prove quite useful in the future. The ones we made were poster ads so we had to engage people with images and limit your text because we humans tend to be kind of lazy and don’t want to read an ad full of text.
For the Worldview however we had to make a video that you have to make completely from scratch. Finding kind of a story of your personal worldview, is not to hard but trying to make it relatively short is. The app we used, I din’t like, because no matter the tutorials I watched and the tips from my friends I found the app confusing and hard to use. My other problem is that I have a really bad tendency to leave things for last minute which eventually will cost me dearly.
The infographics had the same steps as the advertisements. For me one of the main differences between the two projects was that the infographics were in a group of 4 and the advertisements were solitary. I had to step up alongside another person in my group because we had little time left to finish it and our group members weren’t helping much as they were away or sick.
Maker
Maker Project: My main project for Maker so far has been Blue Sky (Star Wars themed).
Probably my least favourite subject out of all four, I just don’t enjoy what we do. Maybe because at my age I don’t really understand how it could be helpful as an adult. I’ve been told that I may not understand now, but I might as well take the opportunity. My parents a have told me this several times, and as a result I kind of believe it, except I still just can’t put my full effort into it because I don’t enjoy it. I have learned that adults will tell you bad things that they have experienced so you don’t have to go through them but kids always get into new bad things, and that’s way every adult will teach a different thing.
The Star Wars exhbition, I find, just pushed me to learn more about Star Wars, but the truth is I never found something in it that I have a big interest on. The project being so big pushed me to make sure I can control my time well or you won’t be prepared, or won’t get much rest. It may seem harsh in short terms but will help in the long run.