
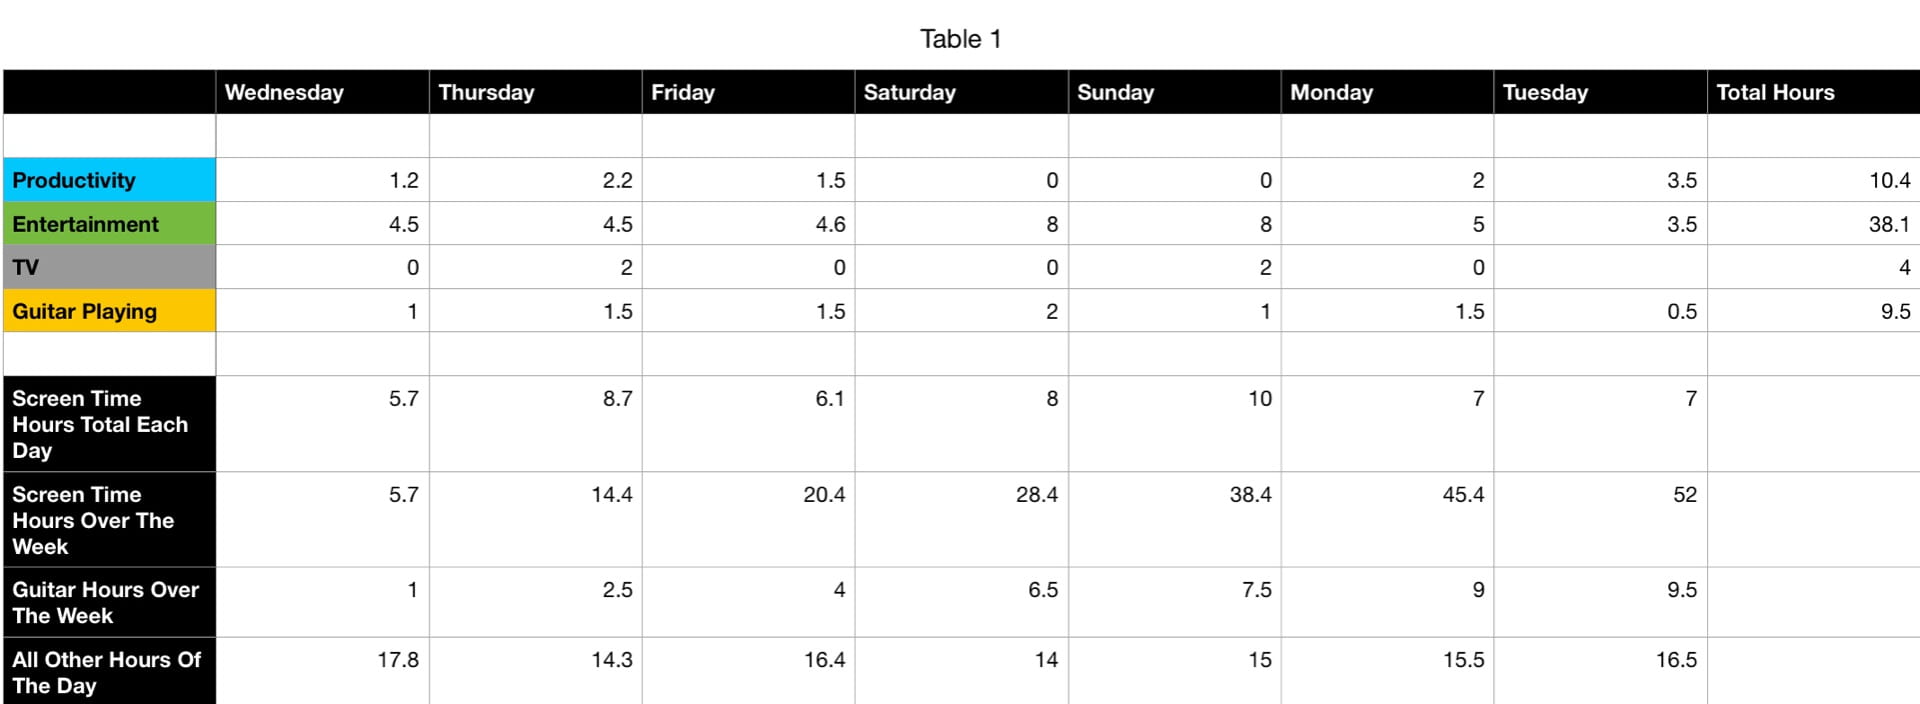
In this project, we had to create charts, tables, and graphs to calculate the amount of screen time we used over which day with specific details on the screens we used. Each day we updated our charts with the hours of screen time we had then spent our time learning different types of fractions and percents. Since our project relied heavily on those skills to create this project we spent everyday working on them.
We had 3 curricular competencies for this project, these are my reflections on those competencies, and how i think i performed.
Applying & Innovating
This competency focuses on contribution to yourself and the people around you, how you affected them, as well as how focused you were on your work. I think I was proficient this area because i was always on task, kept up to date on my charts, worked to together with people to finish the homework on time and to learn it faster. I didn’t distract anyone who was trying to do their work, rarely got distracted myself when i was working.
Understanding & Solving
This competency focuses on trying to understand and solve math concepts, as the name would imply. I think I was proficient in this competency because i always tried my best to understand the work and even if I didn’t fully understand the work I asked for help from other people to understand the work, or if I was in a test I tried to visualize the math in as many different ways to find an answer, even if I knew it wasn’t right. I was able to solve any problems I had in my cell programming and fix them so my chart was clear.
Communicating & Representing
This competency focuses on being able to communicate your chart to people when presenting & being able to represent my work clearly using images or symbols. I believe I could have been more prominence in this competency. My reason being that I was able to communicate my chart and my understanding to the class quite well, shown by my presentation on my tracker. But I don’t think I could represent my work outside of that as clearly as I would have hoped, mon the worksheets my answers and work were written messy. I could do better in this by trying out different ways to show my work and explain my ideas.
After doing the project and experiencing all the competencies I was able to come up with my answer for the projects driving question, the question being: What fraction of your time was screen time? I spent 52 out of 168 hours of my week of screens, however if we divide the numerator & denominator by 4, our answer we be 13 out of 42. Meaning I spent 13 of my week on screens. 42