We just finished a project for scimatics called fractions of my time; for this project, we had to create a spreadsheet that logged our time on screens. We had to do many different assignments to get to our final project; for example, I improved my fractions and converted fractions to percentages. This blog post will show how I got to my final product and my thoughts on it.
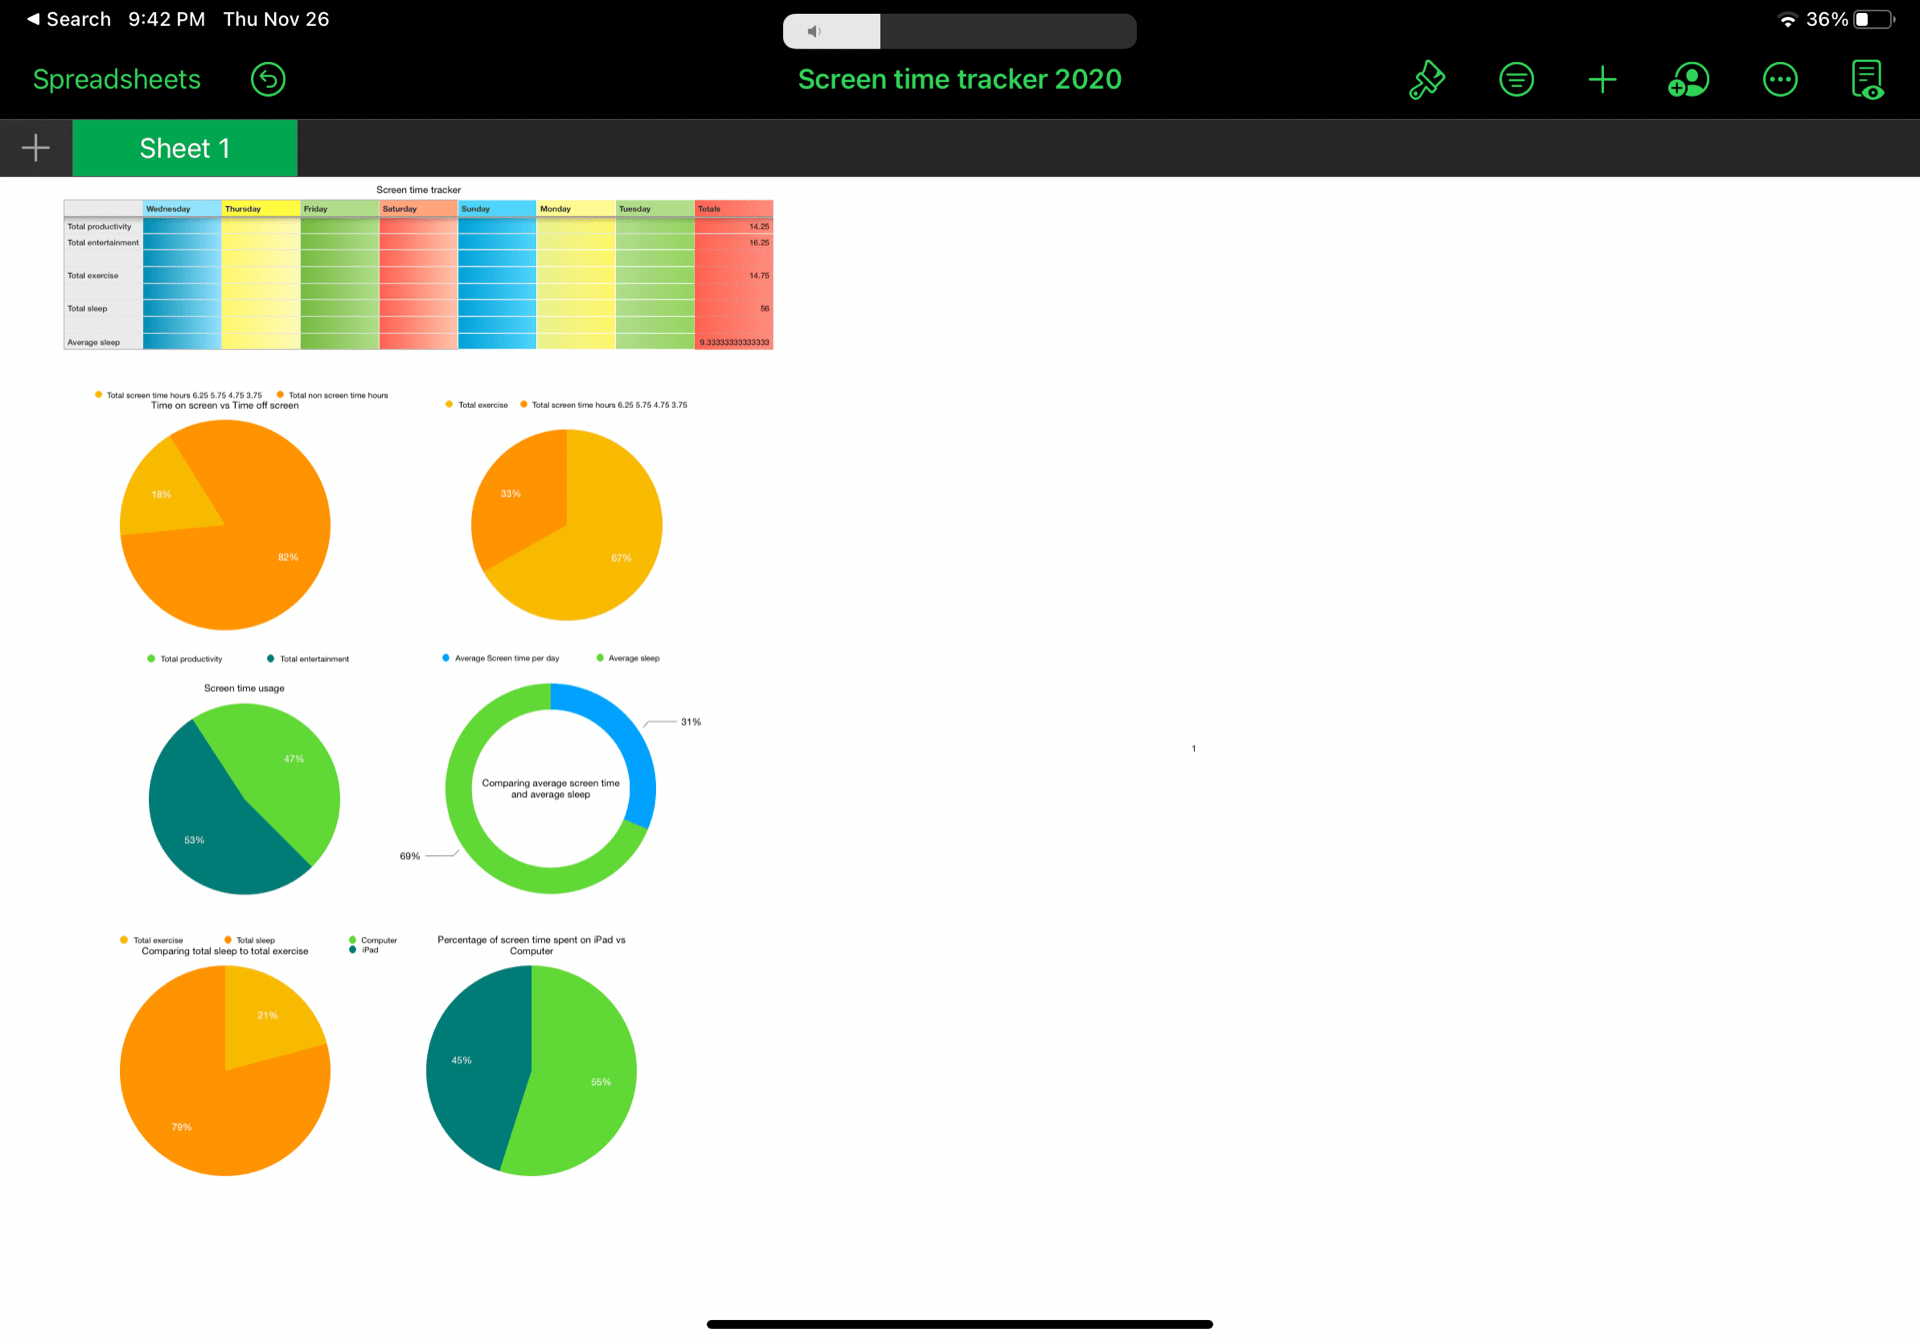
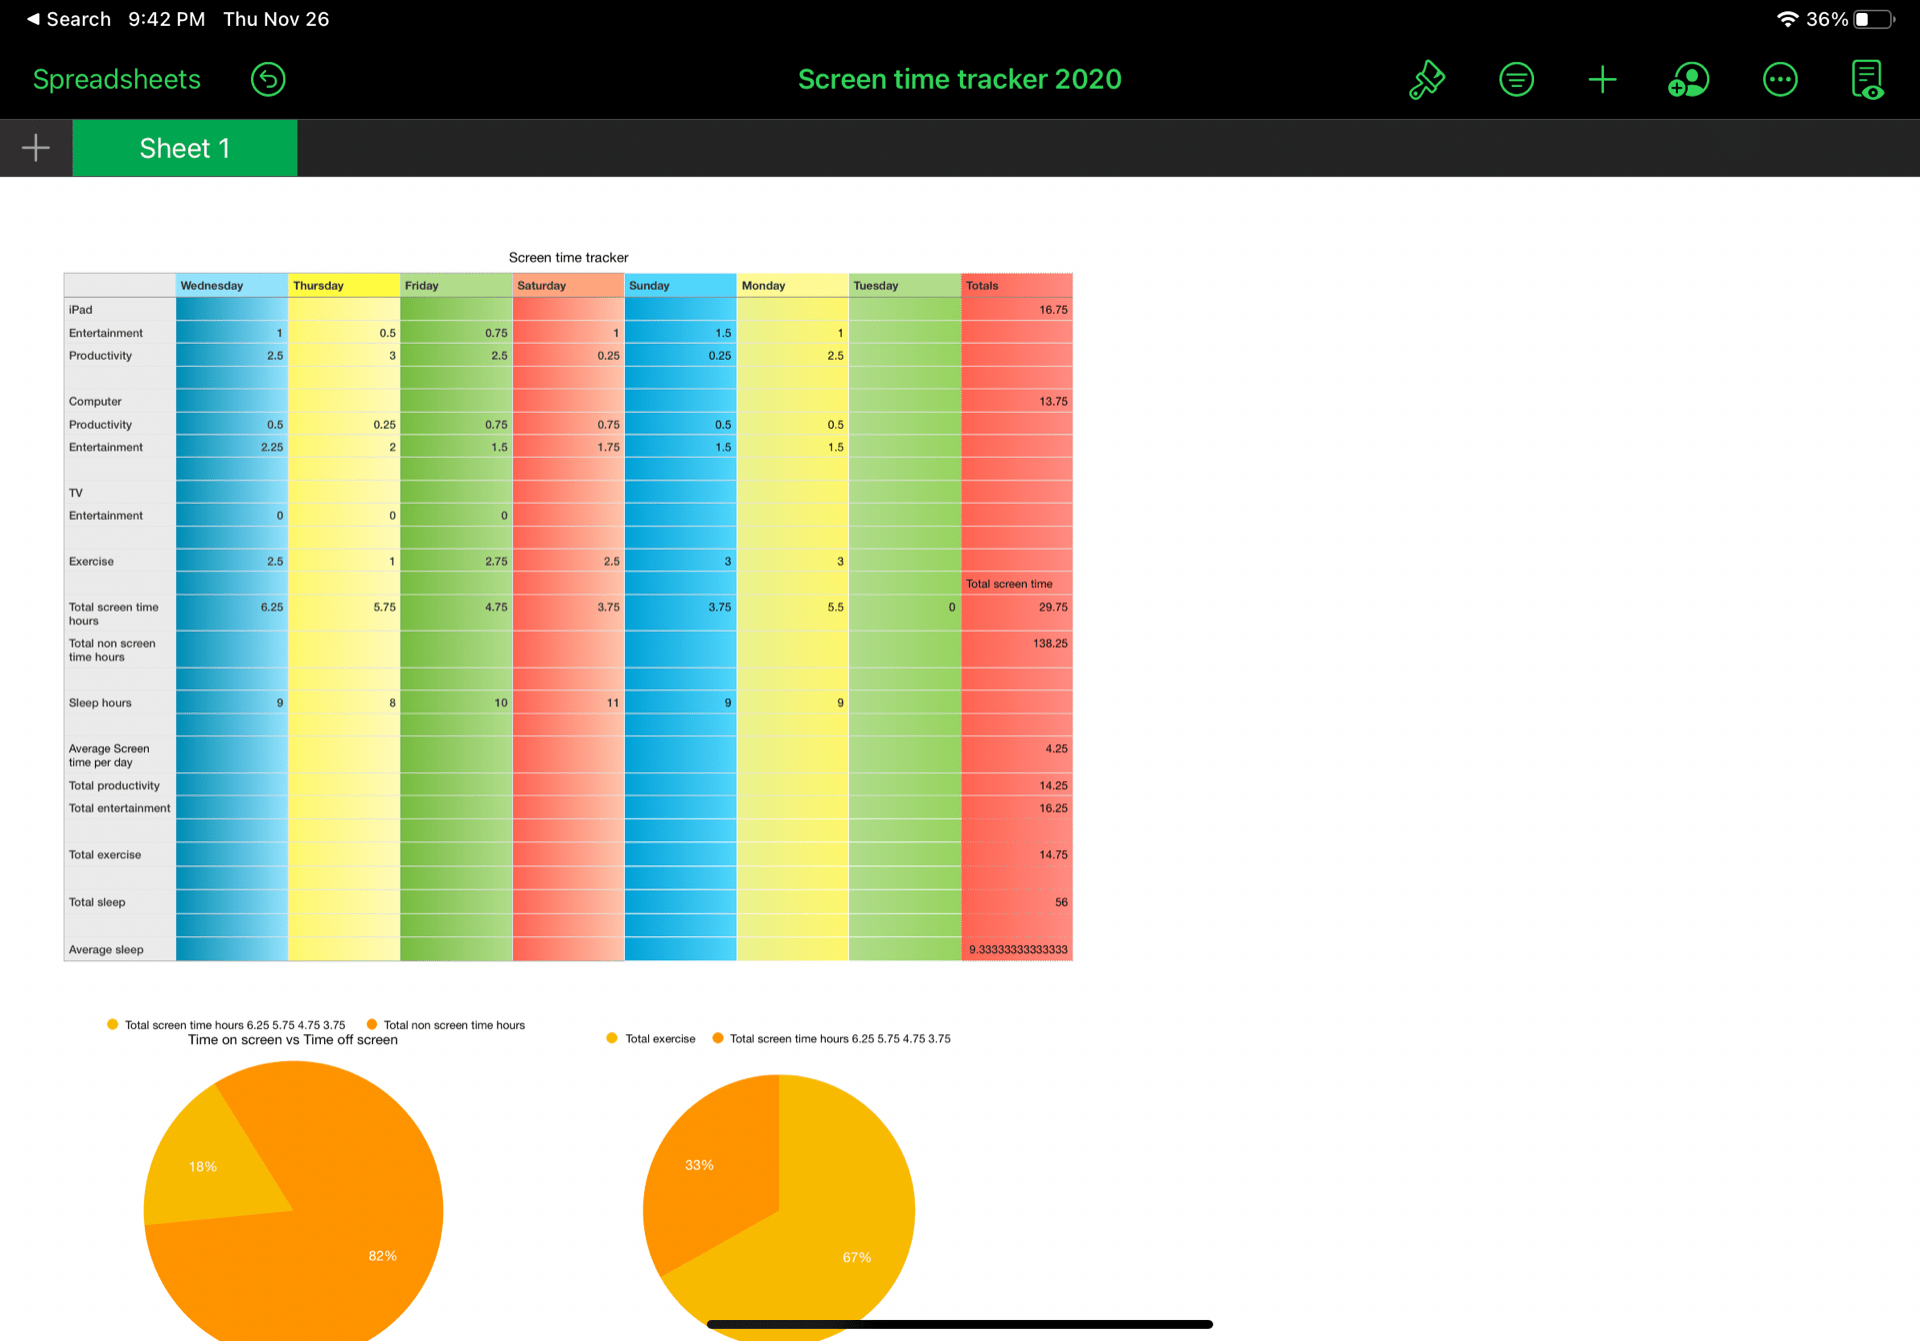
I started this project by first learning how to make and operate; In this stepping stone, we learnt how to calculate our screen time into a total or an average using the spreadsheet. After this, we had time to work and customize our spreadsheets. I added colours to each column to easily make them recognizable and more organized. I added some totals, including Total Sleep, Total Exercise, Total Screen Time and average screen time. This stepping stone used the curricular competency applying and innovating; I felt I did quite well in this competency. I think I went up and beyond. I used all my class time efficiently and did extra for this stepping stone in the time we had.
Another Milestone we did was our Fractions test; In this test, we worked on adding and subtracting fractions; after this test, I significantly improved my understanding of solving and visualizing fractions. I did well on this test as I spent my class time working on the practice sheets.
My spreadsheet presentation went better than I expected as I talked freely and presented my spreadsheet to the best of my extent. I did well on Communicating and Representing as I Presented multiple different proportions and many pie charts and graphs.
Curricular Competencies:
Applying and Innovating
I used my class time proficiently as I worked on my assignments and milestones and didn’t bother anyone else. I feel like I could have done a little bit better with getting distracted, but overall, I’m pretty happy with how I did in this competency
Understanding and solving
I did well in this as I logged all my screen time hours, used the spreadsheet to calculate the average and totals, and used those stats to calculate different fractions and percentages.
Communicating and representing
I made many pie charts that express my screen time, sleep and exercise in different ways. I also used many different fractions and percentages to represent various aspects of my chart.
In conclusion, I learnt a lot about spreadsheets and how to use them, but also I realized that I’m spending a bit too much time on screens. Thanks for reading