SLCs the Sixth: TPOLs

The end of June marks the end of another era in PLP, Grade 10. This was a remarkable year, with ups and downs, triumphs and tribulations, but we made it to the other side, mostly unscathed. So, let us reflect on what we have done, and look forward to our next great adventure.

Of your work completed this year, what are you most proud of? Why?

The project that I am probably most proud of is the WW2 podcast. I had a lot of fun with this project, which makes everything 100x better. This was one of the first podcasts we had done, so it was opening a new chapter for us. This year I’ve had a lot of fun doing podcasts, and this one was no different. The experience of going and meeting with these people was really cool, because instead of just learning about something in a textbook, we got to meet people with first hand experience. I also learned a lot when I talked to Abigail Foulds and my Grandpa, Frank Ward. I am proud of the work I have done for this project.

What piece of work done this year would you share with a class visitor? Why?

A project that I would want to show to a visitor is definitely the generator project. Not necessarily the video that went along with it, but the generator itself. In science, and especially in this project, I fell as though the product is the bigger thing, and the video secondary. This doesn’t really make sense in practical terms, since we are mostly graded on the videos, but I’m usually pro under of what we have actually created. In this project, we took a current issue, and created a project that has actual meaning in the real world. This is why I wanted to do PLP in the first place, and that’s what I would want to show visitors.

How do these projects connect to the adult world outside the classroom?

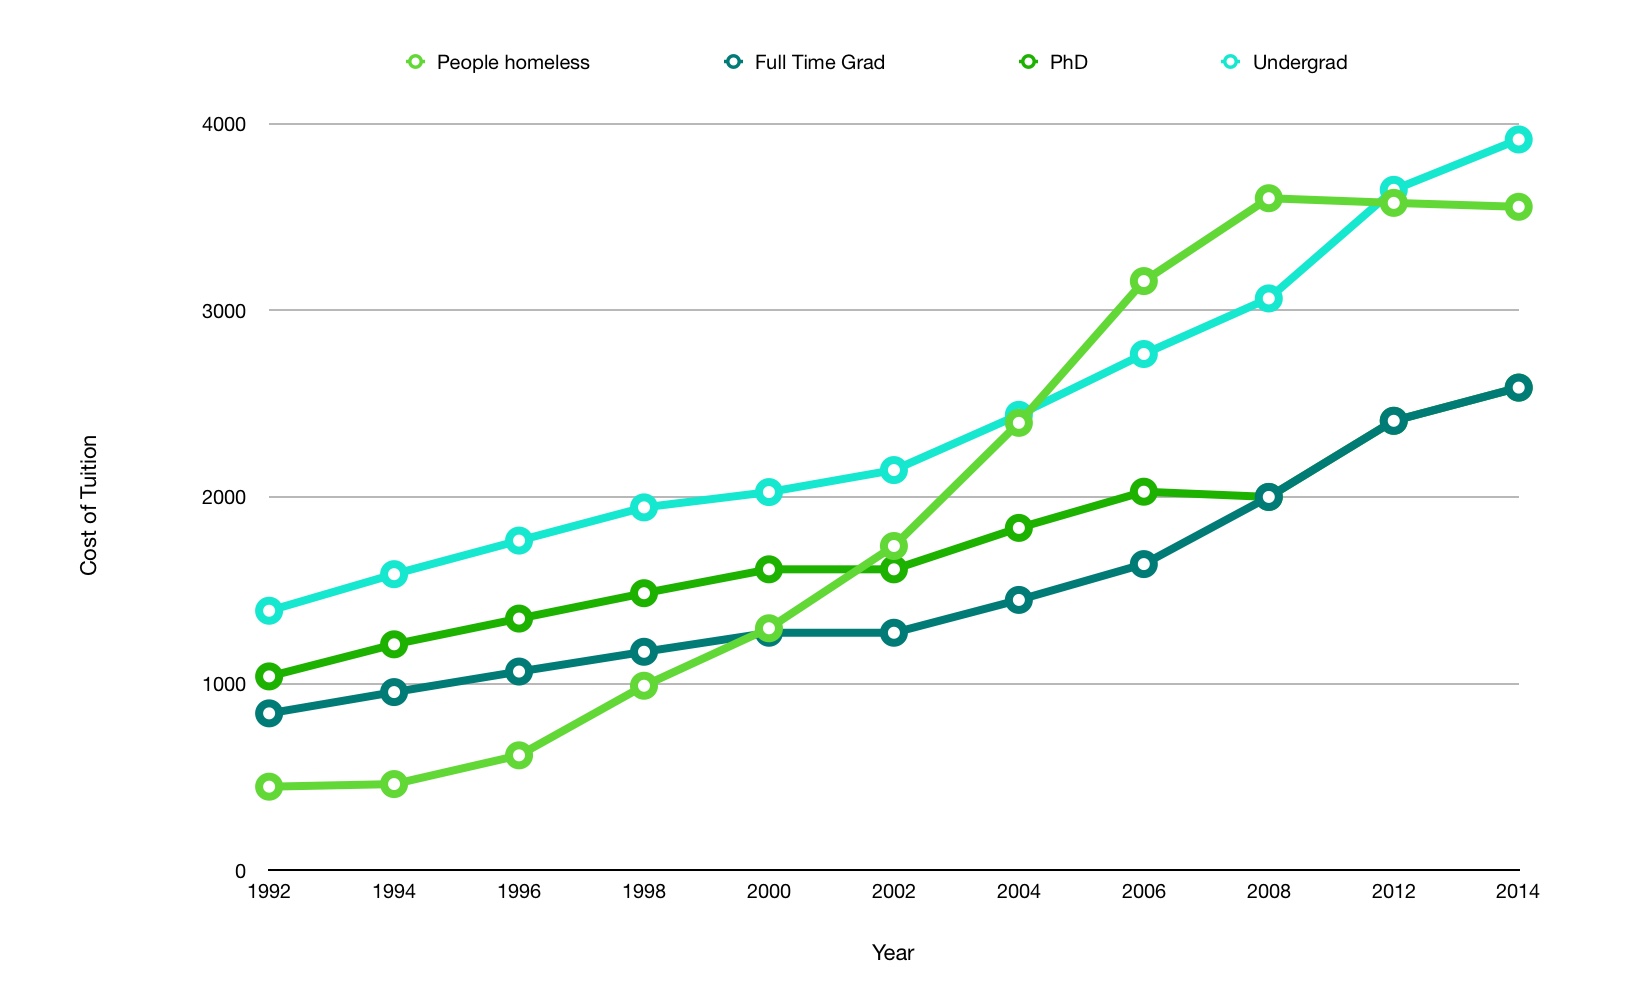
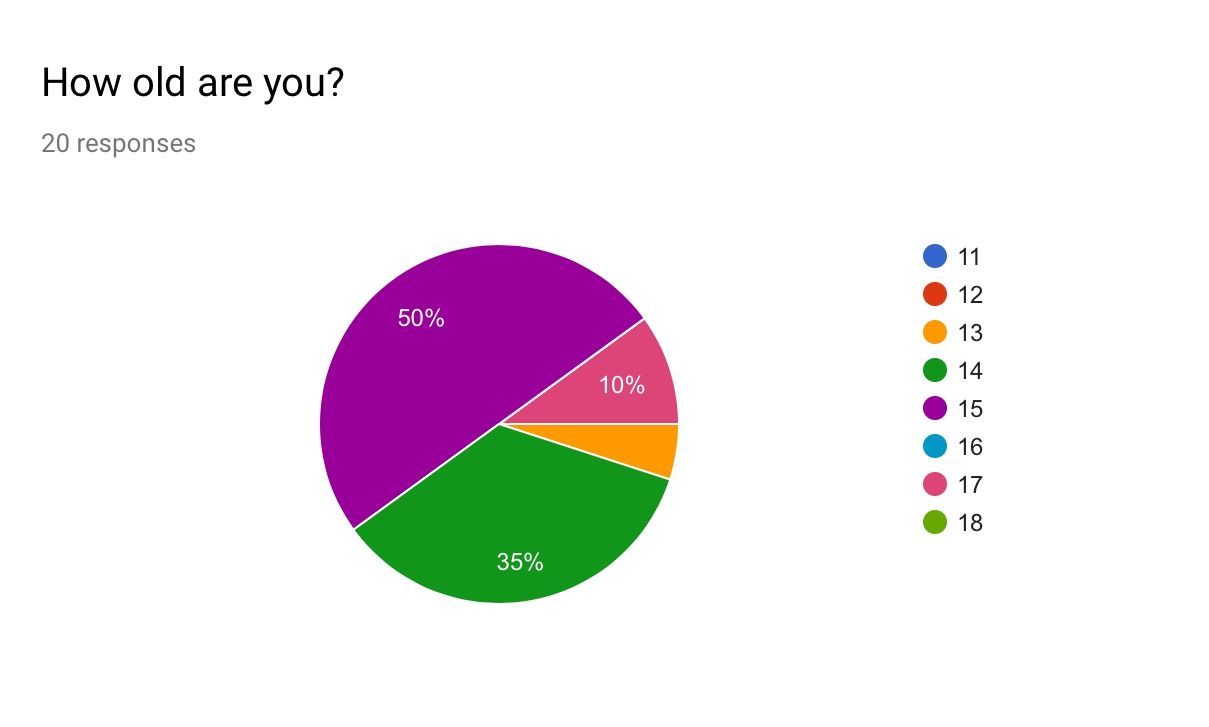
Math is kind of a constant. Sometimes it can be hard to relate math concepts to the real world. This project did a really good job of that, though. For this project, we were looking at real data that scientists and governments had collected, and we had to graph it. Taking these arbitrary numbers, and creating graphs was cool, but to actually see the impact that this could have was even cooler. Emily and I checked the levels where the water rise would start to impact us, and added this to the graphs. It really puts into perspective what is happening in our world, and brings it to us.

What problems did you encounter? How did you solves them?

Finally, we have Destination Imagination. Every year,  talk about Destination Imagination, and how I am working to be a better teammate, but his year I actually did it. Within our group, we had some pretty strong personalities, and with that, some disagreements. There was one pretty bad disagreement, and instead of getting mad or whatever, I took the time to talk to both sides of the argument, and helped them sort it out. It was sometimes frustrating, but in the end it worked out. I’m really proud of how I handled it, and am looking forward to continuing my learning!

Fire Bad, Water Good

Energy, the magical commodity that is destroying our world. Well, not anymore! In science class, we created generators powered by the environment to charge an iPhone!

This project was really cool because we were building something that could actually be used. Like, you could legit take it into the woods, find a stream, and power stuff! I had a lot of fun building it, and then seeing how awesome it actually was by measuring the energy production!

Now, it’s time for curricular competencies!

Contribute to finding solutions to problems at a local and/or global level through inquiry.

For this project, we were focusing on using energy from nature to power our generators. This is really important now, because of all the issues our world is having with global warming. Learning about this, and how to build a generator that uses clean energy, can help us in the future. Also, all the materials we used were reused from previous science projects!

Make observations aimed at identifying their own questions, including increasingly complex ones, about the natural world.

When we were first pitched this task, we had to figure how exactly we were going to capture energy from nature. We had to look at our natural environment, and see what we could create. Seeing as Vancouver is very rainy, and there are many streams nearby, my partner and I decided to create a water powered generator. Water is a very strong force, and our generator worked very well.

Global warming is all around us, making our summers warmer, decreasing our snowpacks, and so much more. The little things we do in class, like reusing materials, can help our world. We had to research what types of generators would use natural energy. Although there are many types of renewable energy sources, our world uses a lot of fossil fuels. Having our project relate to what is actually going on in the world makes the projects seem less far fetched. Knowing how energy is produced can help us in the future.
For this project, we had to graph the energy production of our generators against a solar panel. With our past projects we have done this type of graphing quite a bit, so those skills really transferred over. Seeing how our generator measured up against the solar panel was really cool. The cost saving was less cool. Although it is always cool to see how what we do in class measures up to the real world, energy doesn’t seem to be that expensive, at least to charge your phone. It’d take about 72,000 days for our generator to be the same price as regular energy, but at least it’s something!

All of The Lakes

In this past project, we’ve been looking at linear equations, and how to predict things with them, specifically water levels. Emily and I decided to look at the Great Lakes, and see how they were changing. 

One of the Lakes with the most amount of change was probably Lake Superior, with 0.0583 cm increase each month, when they were taking this data. With that number, we were able to create a graph to show how the water was, and would be, increasing. 

In this project, we used a lot of different curricular competencies, one of the, being…

Model with mathematics in situational contexts.

I used this curricular competency when we were taking the concept of the linear equations, and applying them to a real scenario. Using this real-time data, were were able to create graphical models of what would happen overtime, and the adverse effects this would cause. 

Another curricular competency I used was…

Explore, analyze, and apply mathematical ideas using reason, technology, and other tools.

To make these graphs, we used a tool called Desmos, an app on our iPads. Once we had the equation, it was easy to just input it into the application, and graph it. This visualization in real time made it so you could actually, in real time, see the adverse effects of the rise in water. 

Honestly, who knows?

We have just finished a math project. The project lasted two weeks, on week on lessons, and one week of project time. I missed the entire first week, because I was at Outdoor School. So I really had to draw upon one curricular competency;

Think creatively and with curiosity and wonder when exploring problems.

I had a problem, obviously. I didn’t know what I was supposed to do. Luckily, it was a parter project, so it wasn’t all up to me to figure out how to do everything on my own and do an entire project. Once we had the structure of the project, I devoted myself to trying to figure out what the heck was going on.

I used Khan Academy, my saviour for anything math or science. I had the project outline, and I knew what I was supposed to know. So I learned, listened, practiced, and figured it out all on my own. After that, the project made a lot more sense to me!


KABOOM, white!

Chemistry. There are several different parts of chemistry. Last year, we learned about ionic and covalent bonding. This year, we expanded on that, and looked at how that type of bonding stuff happens. *Cue trumpet music* Chemical Reactions!

In this project, we learned all about the different types of chemical reactions: Combustion, Synthesis, Decomposition, Acid-Base Neutralization, Single Replacement and Double Replacement. In this project, we were spilt into 6 different groups, one for each type of reaction, and studied our chosen reaction. My group was studying double replacement reactions. A double replacement reaction is a reaction where the two positively charged ions in an ionic compound switch places, creating two new ionic compounds! 

To focus are learning even more than the specific chemical reaction, we also had to come up with a driving question. The driving question for our project was…

How Do Double Replacement Reactions Help Doctors With Diagnostics?

We chose this question because we had seen something in the textbook that supported this idea. 

Barium Chloride is a very toxic chemical. But it is aqueous, which means it can be dissolved in water. When this solution, diluted in water, is mixed with Sodium Sulfate, also aqueous and diluted in water, a double replacement reaction occurs. This creates Sodium Chloride, an aqueous compound, and Barium Sulfate, a solid.

This mixture is used by doctors for x-rays. As you probably know, x-rays shine through soft tissue, showing doctors the bone. But when you need a soft tissue x-ray, it’s a bit different. Doctors have their patients drink this concoction just before their x-ray. The barium sulfate blocks x-rays, so you can now do soft-tissue x-rays. 

We presented our findings to the Chemistry 11 class. And honestly, our presentation didn’t go wonderfully. If I were to do this again, I probably would’ve had each task a more group focus, rather than one person do the script, one person do the video, and one person the keynote.

For this project, we were also focusing on curricular competencies. One curricular competency I think this project really demonstrated was  to “Connect scientific explorations to careers in science”. Our group did this by connecting our reaction to the field of medicine. This reaction is used by doctors, and was a huge advancement for x-rays. 

Another curricular competency I used a lot in this project was to “Communicate scientific ideas, claims, information, and perhaps a suggested course of action, for a specific purpose and audience, constructing evidence-based arguments and using appropriate scientific language, conventions, and representations”. I feel as though, even though our keynote may have not been accurate, our language and experiment demonstrated our knowledge of the project.

I also used the curricular competency of “Collaboratively and individually planing, selecting, and useing appropriate investigation methods, including field work and lab experiments,  to collect reliable data (qualitative and quantitative)”. I used this, because a) this was a group project and b) we did an experiment to prove our calculations correct.

Finally, I used the curricular competency of “Useing knowledge of scientific concepts to draw conclusions that are consistent with evidence”. We had an equation, and our hypothesis, but we weren’t sure what was going to happen. As we did the experiment, and studied the equations, we understood how this was a double replacement reation.

SLCs the Fifth: Once again, MPols

This is my 5th SLC, and such, is SCLs the 5th. Now that I have all this experience with MPols and the structure, it is different. Adaptation. Anyways. We’ve started a new course thing called PGP, and through that, we’ve got specific things we need to work on throughout our studies. For PLP 10, they are as follows.

Finding Humour

Applying Past Knowledge to New Situations

Questioning and Posing Problems

Remaining Open to Continuous Learning

And so, I will be telling the journey of my learning through these things! Now, I haven’t really done any focusing on the Finding Humour one, but the rest are there. So, let’s go on to the first one…

Applying Past Knowledge to New Situations

This is a very important thing to be able to use, and to a project in which I think I demonstrated this well was the Trigonometry Project; SohCahToa, the Tropical Trig Island.

The past knowledge that was uses in this project was the circuitry. We learned about this a bunch in Grade 9, and the concept really stuck with me. So for our building, we had actual circuits to demonstrate the use of the solar panels!

Questioning and Posing Problems

Questioning and posing problems is very important for PLP students, as most, if not all of our learning is based around a driving question. Asking questions can help if you don’t understand something, or help deepen your learning. There’ve been two projects this year that this was my main focus. The first one is the Chemistry Unit, which we have only recently started. Chemistry intrigues me, and when we are doing book work and experiments, I want to understand everything fully. So I ask questions, either cementing an observation in my mind, or figuring out new concepts.

Remaining Open to Continuous Learning

Now, this is integral for high school. Because of the curriculum change and stuff, we as students sometimes find ourselves learning the same stuff as before, but in a deeper way. One, not project, but kind of focus in PLP, is video-making. We have made tons and tons of videos, and sometimes it gets a little arduous. This year, we have done many videos, and have been focusing in on refining our skills in our Maker Class. We did this a lot during our Recreation Project; “And Action, Wait, *Thunder* Okay Go”.

For this project, we had to be very technical. Before filming, we had to get all of these different forms in, outlining this story and such. They may seem annoying at the time, but they really help you understand your story. Also with the videos, editing it is a skill I’m still working on. I just am not fully adept in the art that is editing. What I can do is write screenplays, which I have done in several of our group video projects.

Another project, or well, area, that this has come in handy, is the PGP course we’ve started this year in PLP. But the thing is, this isn’t a new concept. From the beginning of Grade 8, we’ve been learning about Growth Mindset *groan* and goal setting. It’s just that this course has really made us accountable for our goals. Not only that, but it has made goal setting clearer to me, and helped me understand what I really need to focus on.

And finally, the project all 10s could refer to for this is the Cray Cray Unit.

The Cray Cray Unit, consisting of 3 big assignments including an essay, a video, and the Winter Exhibition, plus the Seattle Trip, was one of the times this was a necessary asset. We understood the topic so deeply after, and I think that was huge.

That is the biggest part of this, the deeper learning. With all of these skills, we will gain a deeper knowledge of all the topics we work on, something that I don’t think you get from regular school.

And that concludes my MPol!

BUILD YOUR WALL

In Scimathics throughout the month of December, and a little bit of January, we’ve been looking at expanding and factoring algebra. To do this, we’ve used algebra tiles, which are shapes that represent the equations. For example, (x + 3)(3x + 2) would translate to 

After learning about all this, we had to create a game. This game would use algebra tiles to expand and factor different algebraic equations. We created Tower Ball. The goal of the game is to protect your tower from your opponent. We made a video explaining the rules. 

I learned a lot from this video. But instead of doing my usual reflection, we’ve been asked by our teacher to choose different curricular competencies that we worked on during this project and explain how we used them. So that’s exactly what I’m doing!

Connect mathematical concepts with each other, other areas, and personal interests.

For this project, and most projects, it makes it more interesting when you add your personal interests. When you do this, it pushes you to do better. For this project, I made the game have a medival theme. The tower is based off of a tower that I used to drive past often. I feel as though this theme really added to the game, and made it more fun to play!

Think creatively and with curiosity and wonder when exploring problems.

When given the task of creating a game that uses algebra tiles to expand and factor algebraic equations, a lot of us had to really think of what to do. It was hard to come up with an idea, let alone one that would be fun. Me and my partner Tamara looked down several pathways, trying to find a viable idea. Then finally, after many ideas, we came up with tower ball. It would be fun, as including not only math, but also construction and destruction. What more could you want?

Visualize to explore and illustrate mathematical concepts and relationships.

Algebra tiles played a huge part in this project, and their main purpose is to help people visualize algebraic equations, in an actual, physical form. Using the algebra tiles while learning about these concepts was hugely beneficial. When I had these physical things, it really helped me fully comprehend what we were learning. In the video, I think we demonstrate this well. We show how a number, the values on the cards, can be used to solve these equations.

Represent mathematical ideas in concrete, pictorial, and symbolic forms.

Again, this was mostly shown by the algebra tiles. These small pieces of plastic, or in the case of our video, abstract shapes, give physical form to mythical numbers. It demonstrates the intricacies of algebra, while being simple enough that a 5 year old could use them. The tiles show how the math works as well. You can see what’s multiplied together, and come to understand this complicated medium.

Twins Aren’t Identical???

This project was all about genetics. DNA, RNA, all the fun stuff that makes up who you are. And this month, we’re talking about a really fun topic: Twins! More specifically, can cousins be twins? 

The scenario that we were posed with for this project was a bit complicated. Pretty much, two sets of identical twins married each other. Sounds incestuous, I know. Anyways. Due to both sets of parents having the same DNA, we had to see if their kids could be identical. And that would require several little bits of information, which I will now explain. 

Pedigree Charts

Pedigree charts are kinda like a family tree. They show generations, but they’re more focused on traits. Specifically, which traits are passed down to whom and how. 

Punnet Squares

Punnet squares help calculate the likely hood of a child of a couple having certain traits. You take the genotypes from each parent and mash ‘em up till you have 4 outcomes. 

The video explains this better than I do here. 

For this project, I worked with the wonderful Luca J. I would say that we worked well together, and will our different skills, we did a pretty good job. I did the scientific animations, using Keynote and Magic Move. It’s pretty simple but easy to understand. 

This project was really cool. I love learning about how things work, and pretty much everything in science, so it was great! Next time, I would spend a bit more time on my animations, because the magic move wasn’t working in some place. Also, I would add more information about how due to meiosis, it would be very unlikely for cousins to be twins. But overall, I’m pretty proud.

SohCahToa, the Tropical Trig Island

Hello Australians! Ha, reference to our video. Anyways. So, for our first blog post for Scimathics this year, ima talk about something really complecated. Triginometry. Yay.

For the past month, ish, we’ve been learning about the math for, well, triangles. Triangle math. Tri, three, angle, angle. It’s all about the angles. Using triginometry, you can find out all the side lengths and angles of a triangle (as long as you have two points of data previously). Sine, Cosine and Tangent.

For this project, we had to create a video where we explained how solar panels are used and how you can use triginometry to find the optimal angle.

Moderately Similar and Stuff

THIS IS MY LAST GRADE NINE MATH POST. I REPEAT, MY LAST GRADE NINE MATH POST. Wow, it’s been a long year. It’s the end of an era. Math 9, what a class. To go out on a bang, our last project was pretty much entirely up to us. Yup. 

Correlation. Causation. Similar, but not the same. 

We started off this project by looking at a bunch of correlating data. Correlation is when to unrelated points of data follow the same trends. For example, this graph that there is a photo of right here. As you can probably figure, Nicholas Cage movies and the number of people who died by falling into the pool have nothing to do with each other. But the data follows relatively the same pattern. Correlation! Some correlating data has an outside reason that effects them both, but the don’t have to. 

Causation, as I fore mentioned, is similar. But this time, instead of them being unrelated, the directly impact each other. You see, in causation, one data point causes the other. For example, this graph of temperature and ice cream sales. They do follow the same trend, but what makes them causation is that the rise in temperature directly causes the ice cream sales to rise. 

Starting off also, we watched this TED talk that used correlation and causation in their explanation. They used an application called Gapminder, that some of us used in our projects.

For this project, we had to create to questions, one correlation, one causation. I worked with the wonderful Tamara Soltys-Lee. Our questions were as follows. 

“Does the cost of university have a correlation with homelessness?”

And

“Does the time it takes a person to walk to school have a causation with the amount of music they listen to per week?”

(I just found this feature and I think it’s really cool)

I’ll start with the not latter of the two. 

To do this, we had to delegate. I was to research the homeless population from 1992-2014 (because that’s the time frame I could find), and Tamara was to research university tuition. I ended up searching for quite a while, until I found the stats for Calgary’s homeless population. So, I used that data. Tamara, on the other hand, found her information on Pen State University. So they’re really not related. Anyways, we took the information that we found and put it into a chart on numbers. Now, numbers has many great features, including a feature that makes it so you can automatically input your data into a graph. 

(My YouTube is being annoying right now but here there will be a video showing this.)

Our data resulted that these two things follow the same pattern, so, they are correlated!

Now, for the latter of the two!

To get the information for this question, we created a google survey. We then proceeded to send the link to people, via airdrop and social media. We got 20 people to complete our survey!

With this data, and a bit of other research, I was able to put each of these things into a graph. Now, this is where it took a while. I took me three tries to graph the data into a form that would show correlation. Finally, we asked the teacher, and he suggested this.

There would be a best fit line, but I couldn’t find one.

After we collected all this data, we presented it in a keynote!

If I were to do this project again, I would do it exactly the same. Everything went very well.