Correlation VS Causation Project
Hello people. Welcome back to another post today’s reflection is about Correlation vs Causation. So this project was about making surveys and sharing them to people to do. we picked whatever topic we wanted (school appropriate). So our topics were Screen time -amount entertainment apps you have. Our questions were:
- How many hours do you spend on a screen daily?
- Has a screen (computer tablet cellphone) become a part of your daily routine ?
- Do you socialize with people through an electronic device ?
- Do you play video games?
- Do you own a phone or tablet?
- How many entertainment apps do you have? (Instagram Tik Tok Youtube)
- Do you use social media apps to connect with people ?
- Would you rather play or browse games or the web on a screen or do something outside.
So these questions are 4-4 so the first 4 are screen related and the other 4 are app related.
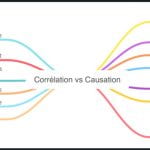
What is correlation. Correlation is when to things happen at the same time but are not a cause of one another i.e Shark Attacks in the summer and ice cream sales these things are correlated because they happen at the time but they don’t cause each other. Causation is when the two factors are caused by a 3rd party factor.
So the final product of this project was a Keynote slide show presentation of us showing our data to our class. All show the Keynote later but now its time for Curricular Competencies
1. Planning and Conducting
This was the collection of data and making of the survey so for the creation of the survey we used Google Forms, we were told to and we sent into Learners Central (which is a Basecamp Team with all PLP learners). I got Accomplished on this competency as our survey was well rounded but it definitely could been improved as we could have put more thought into the questions as there was a survey bias because we asked mostly PLP kids who all have iPads.
2. Communicating and Representing
Use Mathematical vocabulary to contribute to mathematical discussions
This was did we have correct terminology of our words on our presentation. I would say we did as I got accomplished on this competency we used words like “Bias” “convenience sample survey“ and other words that we learned in this project, however I feel as though we could have put more research into the terminology as some of our words could have been explained from a mathematical perspective.
3. Applying and Innovating
We’re we focused and on task during class and were good ethics used while conducting our survey. For the most part yes I say this because there were a couple days where my group and I were off topic playing games and such as for a ethical survey I would say that none of our questions were unethical as you saw because they are mostly questions about devices and apps and we didn’t ask things like “what is your YouTube recommended” or “how many account passwords do you have saved onto your device”.
So the Big Idea for this project was “Analyzing the validity,reliability and representation of data enables us to compare and interpret”. I would say I now understand this, because I got all accomplished on the rubric. But not only that I feel as though if someone were to ask me about correlation and causation I could explain it to them in a clear and concise way.
Our slide show


The milestone for this project were
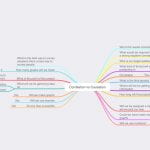
Milestone 1: was a project start mind map done in mindnode here are the before project and end project maps
Milestone 2: was a example survey which had us measure each other in height and hand size and compare them on a scatter plot here is what our looked like

So we did something wrong here as it shows Luca as 7.1 inches tall and the fact that the scatter plot says that the taller you are the smaller your hands get as pointed out my our teacher this is inaccurate.
Milestone 3 was a Survey Plan meaning we just get all of our questions ready to send out
Milestone 4 was imputing the data from our surveys and putting them into a graph

Milestone 5 was presentation outline. Taking our data and showing how will put it into keynote
Milestone 6 was the key presentation its self. As shown above.
Milestone 7 is blog post.
Overall I feel as though this project gave me a deeper understanding or graphs and and different kind of charts
P.S: here are my group members blogs: Declan and Mateo
Bye and don’t forget that Carter=Blog.
Leave a Reply