For our first project in Scimatics we did a screen time tracker where we had to track our screen time over the week.
The very first thing I had to do was to create the chart and set up the sums and percentages in it. I have never used the formulas in Numbers before, but I found it easy to do after I learned how to do it in class.
The next thing I had to do was to track my screen time over a week. I sometimes forgot to input my time so had to estimate. It was surprising how much time I spend on my devices.
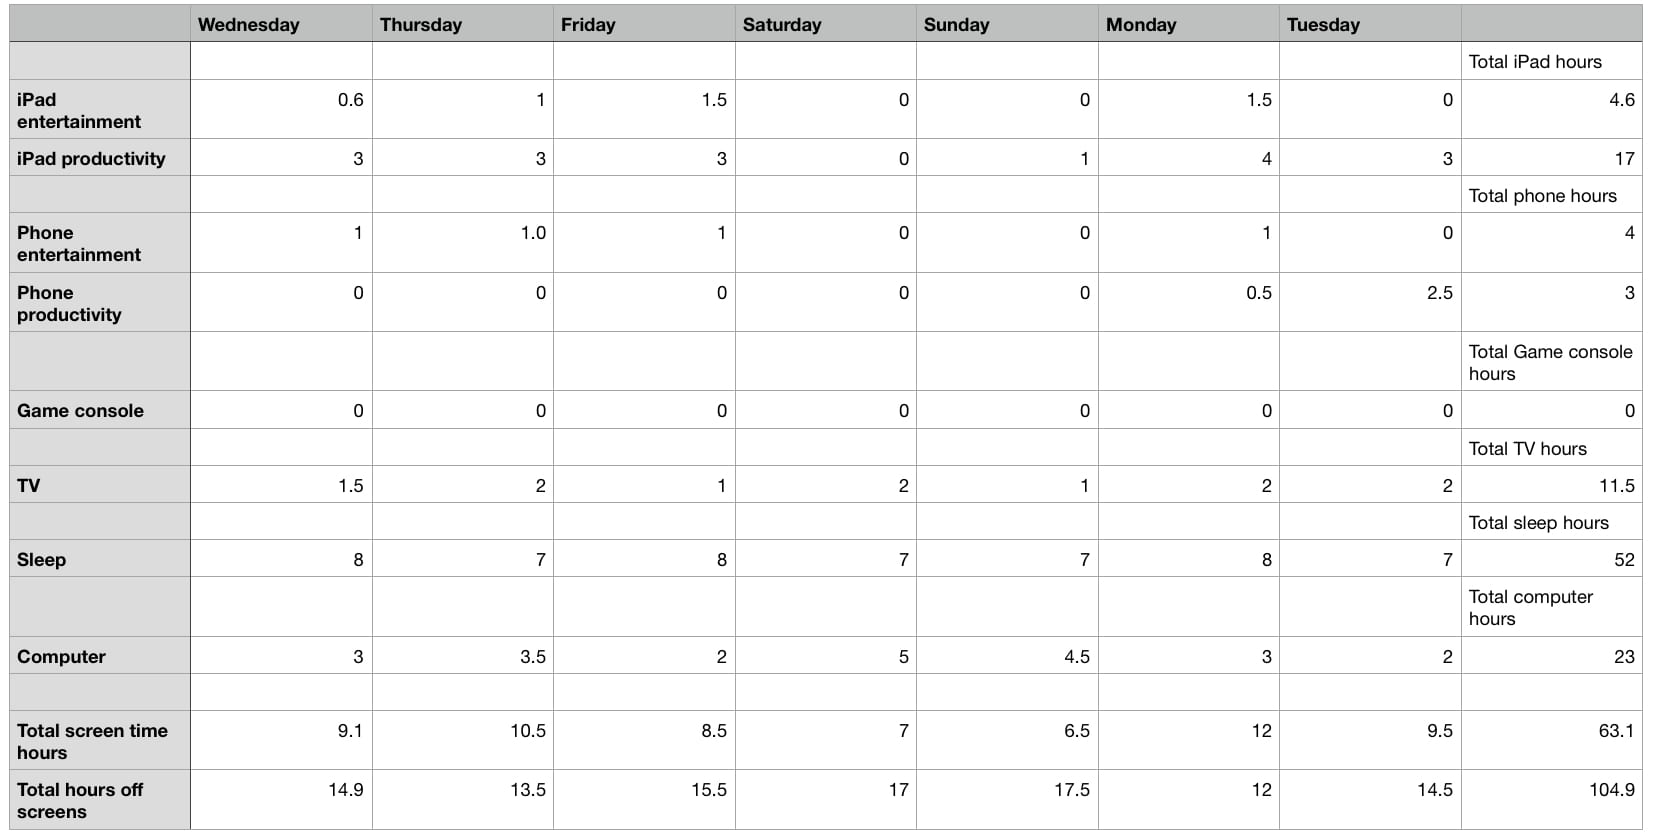
The third thing I had to do was put pie charts into the document and program them to change when I added numbers onto the chart. I also did a colour coded graph. Looking at the charts and graphs makes it easy to see how I use my time.

Finally I had to present to the class. I noticed that everyone’s presentation was similar because teenagers usually spend a lot of time on their screens. I am glad to see that I don’t spend the most time in my class on devices.
I feel like I applied my curricular competencies well.
For Applying and Innovating, I learned a lot about myself and others in the class. Also my presentation went well. One thing that was tough was the presentation because I had to speak in front of the class. I got through it by pretending I wasn’t nervous.
For Understanding and Solving, I worked hard on my chart and also learned more about fractions through looking at how my time breaks down. We learned about fractions in class but the numbers and concepts mean more when they’re about things I do every day. The calculations of screen hours in a day helped me understand fractions in the real world.
For Communicating and Representing, I put in multiple charts and graphs to represent different ways I use my screen time. It helped to see the graphs and charts because it made everything clear. The hardest part was picking which numbers to compare to each other that would have meaning, and give them titles and colours that would make them easy to understand. I am proud of making a few charts and graphs using new skills I learned.
I am really proud of the work I did even though I am not happy about how much time I spent on screens.

Kewl.
Sent from my iPhone